
Testing CellRanger mitochondrial genome integration approaches for scRNAseq data
Goal
The goal of this post is to test two different ways of incorperating the mitochondrial genome into the reference when using CellRanger for scRNAseq analyses. Here, I will be testing 2 different approaches:
- Concatenating the two genomes and gtf files together
- Using the multigenome (barnyard) approach in CellRanger
I also have a version with no mitochondrial genome integration.
Converting mitogenome GFF3 file to GTF:
nano convert.job
#!/bin/bash

#BSUB -J scSeq_convertGTF
#BSUB -q general
#BSUB -P dark_genes
#BSUB -n 6
#BSUB -W 12:00
#BSUB -u kxw755@earth.miami.edu
#BSUB -o convertGTF.out
#BSUB -e convertGTF.err

###################################################################

module load cufflinks/2.2.1

gffread 2023_mitogenome_mle.gff3 -T -o 2023_mitogenome_mle.gtf
bsub < convert.job
Approach 1: Concatenate genome with mitochondrial genome
I will try and concatenate the genomes to then make the ref folder
cat Mle_F31_T2T_v3.fa mle_mitogenome.fasta > Mle_v3_cat.fasta
Check to see if it worked:
wc -l Mle_F31_T2T_v3.fa: 26wc -l mle_mitogenome.fasta: 2wc -l Mle_v3_cat.fasta: 28
cat Mle_F31_T2T_BrakerAnnotationFinal.gtf 2023_mitogenome_mle.gtf > Mle_v3_cat.gtf
Check to see if it worked:
wc -l Mle_F31_T2T_BrakerAnnotationFinal.gtf: 666602wc -l 2023_mitogenome_mle.gtf: 14wc -l Mle_v3_cat.gtf: 666616
Make cat reference
$ nano mkref_cat.job
#!/bin/bash

#BSUB -J scSeq_mkref_mnemi
#BSUB -q general
#BSUB -P dark_genes
#BSUB -n 6
#BSUB -W 12:00
#BSUB -u kxw755@earth.miami.edu
#BSUB -o mnemi_mkref_cat.out
#BSUB -e mnemi_mkref_cat.err

###################################################################

cellranger mkref \
--genome=mnemi_v3_cat --fasta=Mle_v3_cat.fasta --genes=Mle_v3_cat.gtf
$ bsub < mkref_cat.job
I am getting an error:
mkref has failed: error building reference package
Error while parsing GTF file /scratch/projects/dark_genes/Mnemi_phagocyte_genome3_analysis/Mle_F31_T2T_genome/Mle_v3_cat.gtf
Property 'gene_id' not found in GTF line 666603: PG104_mtDNA_np1212     mitfi   exon    440     515     0.05    -       .       transcript_id "transcript_trnL2"; geneID "gene_trnL2";

Please fix your GTF and start again.
After looking at my other gtf file, I think I need to change to “geneID” to “gene_ID”
awk -v OFS='\t' '{ gsub("geneID", "gene_id", $9); print }' 2023_mitogenome_mle.gtf > 2023_mitogenome_mle2.gtf
Lets see if we can make the reference now
cat Mle_F31_T2T_BrakerAnnotationFinal.gtf 2023_mitogenome_mle2.gtf > Mle_v3_cat2.gtf
$ nano mkref_cat.job
#!/bin/bash

#BSUB -J scSeq_mkref_mnemi
#BSUB -q general
#BSUB -P dark_genes
#BSUB -n 6
#BSUB -W 12:00
#BSUB -u kxw755@earth.miami.edu
#BSUB -o mnemi_mkref_cat.out
#BSUB -e mnemi_mkref_cat.err

###################################################################

cellranger mkref \
--genome=mnemi_v3_cat --fasta=Mle_v3_cat.fasta --genes=Mle_v3_cat2.gtf
$ bsub < mkref_cat.job
Count
Run_1_AllCells
nano count_R1_AllCells_v3_cat.job
#BSUB -J count_allcells
#BSUB -q bigmem
#BSUB -P dark_genes
#BSUB -n 16
#BSUB -W 120:00
#BSUB -R "rusage[mem=15000]"
#BSUB -u kxw755@earth.miami.edu
#BSUB -o count_allcells_cat.out
#BSUB -e count_allcells_cat.err
#BSUB -B
#BSUB -N
###################################################################

cellranger count \
 --id=AllCells_v3_cat \
 --transcriptome=/scratch/projects/dark_genes/Mnemi_phagocyte_genome3_analysis/Mle_F31_T2T_genome/mnemi_v3_cat \
 --fastqs=/scratch/projects/dark_genes/Mnemi_phagocyte_genome3_analysis/10X_round1/Round1_AllCells \
 --sample=4-TotalCells
bsub < count_R1_AllCells_v3_cat.job
Export
scp -r kxw755@pegasus.ccs.miami.edu:/scratch/projects/dark_genes/Mnemi_phagocyte_genome3_analysis/10X_round1/Round1_AllCells/AllCells_v3_cat/outs/web_summary.html /Users/kevinwong/MyProjects/Mnemi_Phagocyte/output/CellRanger/V3_genome/R1_AllCells_v3_cat_web_summary.html

scp -r kxw755@pegasus.ccs.miami.edu:/scratch/projects/dark_genes/Mnemi_phagocyte_genome3_analysis/10X_round1/Round1_AllCells/AllCells_v3_cat/outs/filtered_feature_bc_matrix.h5 /Users/kevinwong/MyProjects/Mnemi_Phagocyte/output/CellRanger/V3_genome/R1_AllCells_v3_cat_filtered_feature_bc_matrix.h5

scp -r kxw755@pegasus.ccs.miami.edu:/scratch/projects/dark_genes/Mnemi_phagocyte_genome3_analysis/10X_round1/Round1_AllCells/AllCells_v3_cat/outs/metrics_summary.csv /Users/kevinwong/MyProjects/Mnemi_Phagocyte/output/CellRanger/V3_genome/R1_AllCells_v3_cat_metrics_summary.csv
Apporoach 2: Combining the genomes with the barnyard approach
Make the comb reference
$ nano mkref_comb.job
#!/bin/bash

#BSUB -J scSeq_mkref_mnemi
#BSUB -q general
#BSUB -P dark_genes
#BSUB -n 6
#BSUB -W 12:00
#BSUB -u kxw755@earth.miami.edu
#BSUB -o mnemi_mkref_comb.out
#BSUB -e mnemi_mkref_comb.err

###################################################################

cellranger mkref \
--genome=mnemi_v3 --fasta=Mle_F31_T2T_v3.fa --genes=Mle_F31_T2T_BrakerAnnotationFinal.gtf \
--genome=mle_mitogenome --fasta=mle_mitogenome.fasta --genes=2023_mitogenome_mle2.gtf
$ bsub < mkref_comb.job
Count
Run_1_AllCells
nano count_R1_AllCells_v3_comb.job
#BSUB -J count_allcells
#BSUB -q bigmem
#BSUB -P dark_genes
#BSUB -n 16
#BSUB -W 120:00
#BSUB -R "rusage[mem=15000]"
#BSUB -u kxw755@earth.miami.edu
#BSUB -o count_allcells_comb.out
#BSUB -e count_allcells_comb.err
#BSUB -B
#BSUB -N
###################################################################

cellranger count \
 --id=AllCells_v3_comb \
 --transcriptome=/scratch/projects/dark_genes/Mnemi_phagocyte_genome3_analysis/Mle_F31_T2T_genome/mnemi_v3_and_mle_mitogenome \
 --fastqs=/scratch/projects/dark_genes/Mnemi_phagocyte_genome3_analysis/10X_round1/Round1_AllCells \
 --sample=4-TotalCells
bsub < count_R1_AllCells_v3_comb.job
Export
scp -r kxw755@pegasus.ccs.miami.edu:/scratch/projects/dark_genes/Mnemi_phagocyte_genome3_analysis/10X_round1/Round1_AllCells/AllCells_v3_comb/outs/web_summary.html /Users/kevinwong/MyProjects/Mnemi_Phagocyte/output/CellRanger/V3_genome/R1_AllCells_v3_comb_web_summary.html

scp -r kxw755@pegasus.ccs.miami.edu:/scratch/projects/dark_genes/Mnemi_phagocyte_genome3_analysis/10X_round1/Round1_AllCells/AllCells_v3_comb/outs/filtered_feature_bc_matrix.h5 /Users/kevinwong/MyProjects/Mnemi_Phagocyte/output/CellRanger/V3_genome/R1_AllCells_v3_comb_filtered_feature_bc_matrix.h5

scp -r kxw755@pegasus.ccs.miami.edu:/scratch/projects/dark_genes/Mnemi_phagocyte_genome3_analysis/10X_round1/Round1_AllCells/AllCells_v3_comb/outs/metrics_summary.csv /Users/kevinwong/MyProjects/Mnemi_Phagocyte/output/CellRanger/V3_genome/R1_AllCells_v3_comb_metrics_summary.csv

Seruat Analysis
Here I will perform the Seurat analysis until the QC step to see how many cells are removed based on mitochondrial reads.
Install and load dependencies
# Load packages
library(Seurat)
library(tidyverse)
library(patchwork)
library(gprofiler2)
All Cells - no mito
Load the dataset
allcells.data <- Read10X_h5(filename = '../../output/CellRanger/V3_genome/R1_AllCells_v3_filtered_feature_bc_matrix.h5')
str(allcells.data)

# Initialize the Seurat object with the raw (non-normalized data).
allcells <- CreateSeuratObject(counts = allcells.data, project = "AllCells", min.cells = 3, min.features = 200)
allcells
QC and selecting cells for further analysis
# Visualize QC metrics as a violin plot
VlnPlot(allcells, features = c("nFeature_RNA", "nCount_RNA"), ncol = 2)

# FeatureScatter is typically used to visualize feature-feature relationships, but can be used
# for anything calculated by the object, i.e. columns in object metadata, PC scores etc.

#plot1 <- FeatureScatter(allpop, feature1 = "nCount_RNA", feature2 = "percent.mt")
allcells_plot2 <- FeatureScatter(allcells, feature1 = "nCount_RNA", feature2 = "nFeature_RNA")
allcells_plot2

allcells

#3444 cells

# subest for features > 200 and < 3000, counts < 20000
allcells_sub <- subset(allcells, subset = nFeature_RNA > 200 & nFeature_RNA < 3000 & nCount_RNA < 10000)

#plot1_sub <- FeatureScatter(allpop_sub, feature1 = "nCount_RNA", feature2 = "percent.mt")
allcells_plot2_sub <- FeatureScatter(allcells_sub, feature1 = "nCount_RNA", feature2 = "nFeature_RNA")
allcells_plot2_sub

allcells_sub

# 3224 cells
All Cells - concatenated
Load the dataset
allcells_cat.data <- Read10X_h5(filename = '../../output/CellRanger/V3_genome/R1_AllCells_v3_cat_filtered_feature_bc_matrix.h5')
str(allcells_cat.data)

# Initialize the Seurat object with the raw (non-normalized data).
allcells_cat <- CreateSeuratObject(counts = allcells_cat.data, project = "AllCells_cat", min.cells = 3, min.features = 200)
allcells_cat
QC and selecting cells for further analysis
# The [[ operator can add columns to object metadata. This is a great place to stash QC stats

allcells_cat[["percent.mt"]] <- PercentageFeatureSet(allcells_cat, pattern = "^gene-")

# Visualize QC metrics as a violin plot
VlnPlot(allcells_cat, features = c("nFeature_RNA", "nCount_RNA", "percent.mt"), ncol = 3)

allcells_cat_plot1 <- FeatureScatter(allcells_cat, feature1 = "nCount_RNA", feature2 = "percent.mt")
allcells_cat_plot2 <- FeatureScatter(allcells_cat, feature1 = "nCount_RNA", feature2 = "nFeature_RNA")
allcells_cat_plot1 + allcells_cat_plot2

allcells_cat

# 3335 cells

# subest for features > 200 and < 3000, counts < 20000
allcells_cat_sub <- subset(allcells_cat, subset = nFeature_RNA > 200 & nFeature_RNA < 3000 & nCount_RNA < 10000 & percent.mt < 0.2)

allcells_cat_plot1_sub <- FeatureScatter(allcells_cat_sub, feature1 = "nCount_RNA", feature2 = "percent.mt")
allcells_cat_plot2_sub <- FeatureScatter(allcells_cat_sub, feature1 = "nCount_RNA", feature2 = "nFeature_RNA")

allcells_cat_plot1_sub + allcells_cat_plot2_sub

allcells_cat_sub

# 3136 cells
All Cells - combined
Load the dataset
allcells_comb.data <- Read10X_h5(filename = '../../output/CellRanger/V3_genome/R1_AllCells_v3_comb_filtered_feature_bc_matrix.h5')
str(allcells_comb.data)

# Initialize the Seurat object with the raw (non-normalized data).
allcells_comb <- CreateSeuratObject(counts = allcells_comb.data, project = "AllCells3_comb", min.cells = 3, min.features = 200)
allcells_comb

#8406 cells
QC and selecting cells for further analysis
# The [[ operator can add columns to object metadata. This is a great place to stash QC stats
allcells_comb[["percent.mt"]] <- PercentageFeatureSet(allcells_comb, pattern = "^mle")
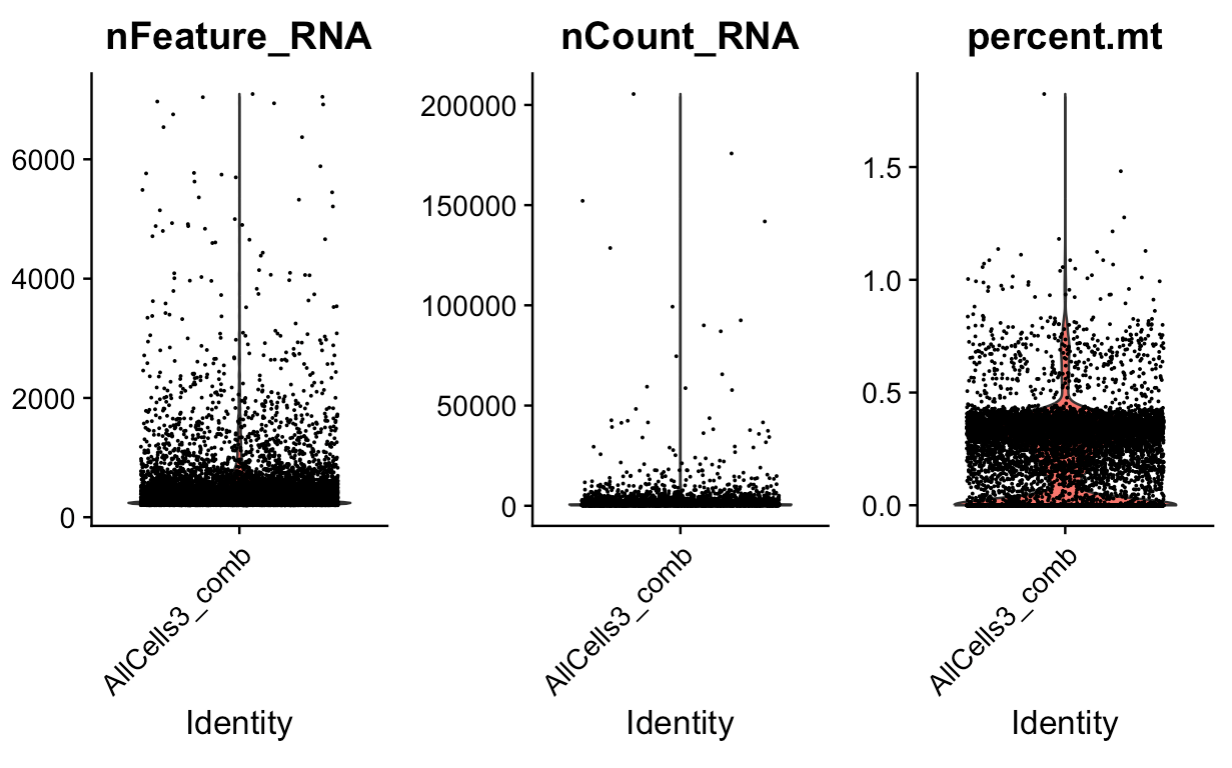
# Visualize QC metrics as a violin plot
VlnPlot(allcells_comb, features = c("nFeature_RNA", "nCount_RNA", "percent.mt"), ncol = 3)
allcells_comb_plot1 <- FeatureScatter(allcells_comb, feature1 = "nCount_RNA", feature2 = "percent.mt")
allcells_comb_plot2 <- FeatureScatter(allcells_comb, feature1 = "nCount_RNA", feature2 = "nFeature_RNA")
allcells_comb_plot1 + allcells_comb_plot2
allcells_comb
# 8406 cells
# subest for features > 200 and < 3000, counts < 20000
allcells_comb_sub <- subset(allcells_comb, subset = nFeature_RNA > 200 & nFeature_RNA < 3000 & nCount_RNA < 10000 & percent.mt < 0.2)

allcells_comb_plot1_sub <- FeatureScatter(allcells_comb_sub, feature1 = "nCount_RNA", feature2 = "percent.mt")
allcells_comb_plot2_sub <- FeatureScatter(allcells_comb_sub, feature1 = "nCount_RNA", feature2 = "nFeature_RNA")

allcells_comb_plot1_sub + allcells_comb_plot2_sub

allcells_comb_sub

#3531 cells
Summary
Table 1. Summary table of cell counts numbers before and after QC filtering
| # Cells before filtering | # Cells after filtering | |
|---|---|---|
| AllCells (no mito) | 3444 | 3224 |
| AllCells (cat) | 3335 | 3136 |
| AllCells (comb) | 8406 | 3531 |
In summary - I think that the concatenated version is the most conservative, therefore we should go with this approach. The combination (barnyard) method increases the number of cells, which gives me less confidence in the quality of these cells.