SATURN 4-species: ESM-1b vs ESMC-600M embeddings for macrogenes
Status (Oct 6): in progress. This entry compares ESM-1b with ESMC-600M as delivered. A third run with length-normalized ESMC (the rescaling fix, Results section 3) is still running (05b2, job 581107; pretraining epoch ~128/200 on node n131). The rescaled comparison, the eggNOG ortholog benchmark (05g) and the final model choice will go in a follow-up entry.
- Question: which protein language model should feed the next full SATURN run: ESM-1b (what the canonical run used) or ESMC-600M (embeddings from collaborator Ingrid Miranda Perez, made with FANTASIA v4)?
- Design change: Spur (sea urchin) is permanently dropped. The atlas is now 4 species: Mnemiopsis leidyi (Mlei), Crassostrea gigas (Cgig), Ciona robusta (Crob), Danio rerio (Drer).
- Main finding so far: the ESMC vectors as delivered have very different lengths (L2 norm about 1,700–8,900, vs. about 16–20 for ESM-1b; Table 4), and SATURN builds its starting macrogenes with Euclidean KMeans on the raw vectors. The first ESMC run was therefore partly grouping genes by vector length. A length-normalized ESMC run is now going so the two models can be compared fairly.
- Scripts: linked in Table 2 (copies in
pipelines/scripts/saturn_embedding_comparison/; working versions live inscripts/SATURN/of the project repo).
Background
ESM-1b vs ESMC-600M
SATURN represents every gene by a protein language model (PLM) embedding of its protein, then groups genes from all species into “macrogenes” based on those embeddings. The choice of PLM therefore decides which genes can be compared across species (Table 1).
| ESM-1b | ESMC-600M (ESM Cambrian) | |
|---|---|---|
| Developer, year | Meta AI (Rives et al. 2021, PNAS) | EvolutionaryScale, Dec 2024 |
| Size | ~650M parameters, 33 layers | ~600M parameters, 36 layers |
| Embedding dimension | 1,280 | 1,152 |
| Training data | UniRef50 (~27M sequences) | UniRef + MGnify + JGI metagenomes (~2.8B sequences, clustered) |
| Max protein length | 1,022 aa (longer proteins truncated) | 2,048 tokens |
| How our embeddings were made | SATURN’s own pipeline: final layer, averaged over residues, isoforms averaged per gene | FANTASIA v4 (Ingrid Miranda Perez): HDF5 type_5/layer_0; converted to genes by 05, isoforms averaged per gene |
ESMC was trained on roughly 100× more (and more diverse, metagenome-rich) sequence than ESM-1b, so it may place distantly related proteins (e.g. ctenophore vs vertebrate) more accurately. That is the reason to test it, not a guarantee.
What sets an embedding’s vector length
The vector length (L2 norm) of a gene embedding is not biologically meaningful by itself; it mostly reflects how the vector was extracted:
- Layer and normalization. Transformers add to a running “residual stream” layer by layer, so raw hidden states get larger with depth. Many models apply a final normalization step before output; vectors taken after it have fairly constant length (ESM-1b in SATURN: ~16–20), vectors taken before it can be much larger and dominated by a few dimensions.
- Pooling over residues. A protein embedding is built from one vector per amino acid. Averaging gives a length that is roughly independent of protein length; summing makes length grow with protein length. FANTASIA’s release notes describe mean pooling with special tokens excluded; which layer
layer_0refers to is not documented (it appears to be the final hidden layer). - How similar the residue vectors are. Averaging many vectors that point in different directions gives a shorter result, so proteins with more heterogeneous residue representations get shorter averages.
- Isoform averaging. Both pipelines average isoforms into one gene vector; dissimilar isoforms shorten the result.
- Truncation. ESM-1b only sees the first 1,022 aa of long proteins.
This matters here because SATURN’s macrogene initialization uses Euclidean distance on the raw vectors (Results, sections 3–4): if lengths vary a lot, genes get grouped partly by length.
This is a known issue in language-model embeddings
Length and outlier-dimension effects distorting similarity are well documented, mostly outside biology:
- In BERT and GPT-2, 1–3 “rogue dimensions” dominate cosine similarity and Euclidean distance without dominating model behaviour; simple standardization of each dimension fixes the comparisons (Timkey & van Schijndel 2021).
- Large language models carry “massive activations”: a few hidden-state values >10,000× the median, in fixed dimensions and tied to tokens like the start token (Sun et al. 2024). Hidden states taken before a model’s final normalization can therefore have very large lengths.
- In protein language models, start/end tokens of ESM-2 and Ankh have a “much larger norm” than residue vectors and had to be excluded from analysis (Beshkov & Malthe-Sørenssen 2025); some PLMs use only a handful of their embedding dimensions effectively (Hakim et al. 2025); and how residue vectors are pooled changes downstream results (Pool PaRTI; optimal-transport pooling).
- Vector length can also carry information: in word embeddings it tracks word frequency/importance (Schakel & Wilson 2015), consistent with ESMC length following protein similarity here (Results, section 4).
The standard response is to normalize or standardize embeddings before comparing them. I found no published report of this specific case, where SATURN feeds unnormalized gene embeddings into Euclidean KMeans and a PLM with highly variable vector lengths reshapes the macrogenes.
Approach: macrogene-only runs
Which genes go into which macrogene is fixed during SATURN’s pretraining step (--pretrain_epochs, default 200). The later metric-learning step trains the cell embedding on top of it and does not change gene membership. So each model can be compared cheaply by running pretraining in full and only --epochs 1 of metric learning, instead of a ~72 h full run.
All runs use the canonical settings: --num_macrogenes 3000, --hv_genes 8000, --seed 42.
| Script | What it does |
|---|---|
05_convert_esmc_embeddings.py |
FANTASIA HDF5 (1152-dim) → SATURN {gene: tensor} .pt; isoforms averaged; same gene-ID bridges as before |
05a_macrogene_only_ESM1b_4sp.sh |
4-species macrogene-only run, ESM-1b |
05b_macrogene_only_ESMC600M_4sp.sh |
same, ESMC-600M as converted |
05c_compare_macrogenes_ESM1b_vs_ESMC.py (.sh) |
compares runs by which genes are grouped together (macrogene IDs are arbitrary per run) |
05d_embedding_species_structure.py (.sh) |
checks the raw embeddings before SATURN |
05e_rescale_esmc_embeddings.py |
ESMC vectors → unit length × mean ESM-1b length |
05b2_macrogene_only_ESMC600M_rescaled_4sp.sh |
macrogene-only run on the rescaled ESMC (running; results in next entry) |
05f_embedding_descriptives.py (.sh) |
per-model / per-species embedding stats and figures |
05g_compare_runs_orthology.py (.sh) |
4-run comparison + eggNOG Metazoa-OG benchmark |
05h_norm_vs_macrogene.py (.sh) |
does ESMC vector length explain the macrogene assignments? |
# deploy + submit (from the project repo on my Mac)
rsync -avz scripts/SATURN/05* kxw755@pegasus2.ccs.miami.edu:/scratch/dark_genes/SATURN_Mnemi/scripts/
bsub < /scratch/dark_genes/SATURN_Mnemi/scripts/05c_compare_macrogenes_ESM1b_vs_ESMC.sh
Results
1. ESM-1b vs ESMC (as converted): very different macrogenes
Comparisons use the 31,808 HV genes shared by both runs (8,000 each for Mlei/Cgig/Crob, 7,808 for Drer).
| Agreement (ARI) | All | Mlei | Cgig | Crob | Drer |
|---|---|---|---|---|---|
| Canonical 5sp ESM-1b vs ESM-1b 4sp | 0.41 | 0.47 | 0.53 | 0.41 | 0.38 |
| Canonical 5sp ESM-1b vs ESMC 4sp | 0.17 | 0.24 | 0.34 | 0.20 | 0.11 |
| ESM-1b 4sp vs ESMC 4sp | 0.18 | 0.25 | 0.34 | 0.21 | 0.11 |
- Model, not species set, drives the change (Table 3). Dropping Spur with the same model keeps ARI at about 0.41. Switching to ESMC halves it, and ESMC is equally far from both ESM-1b runs.
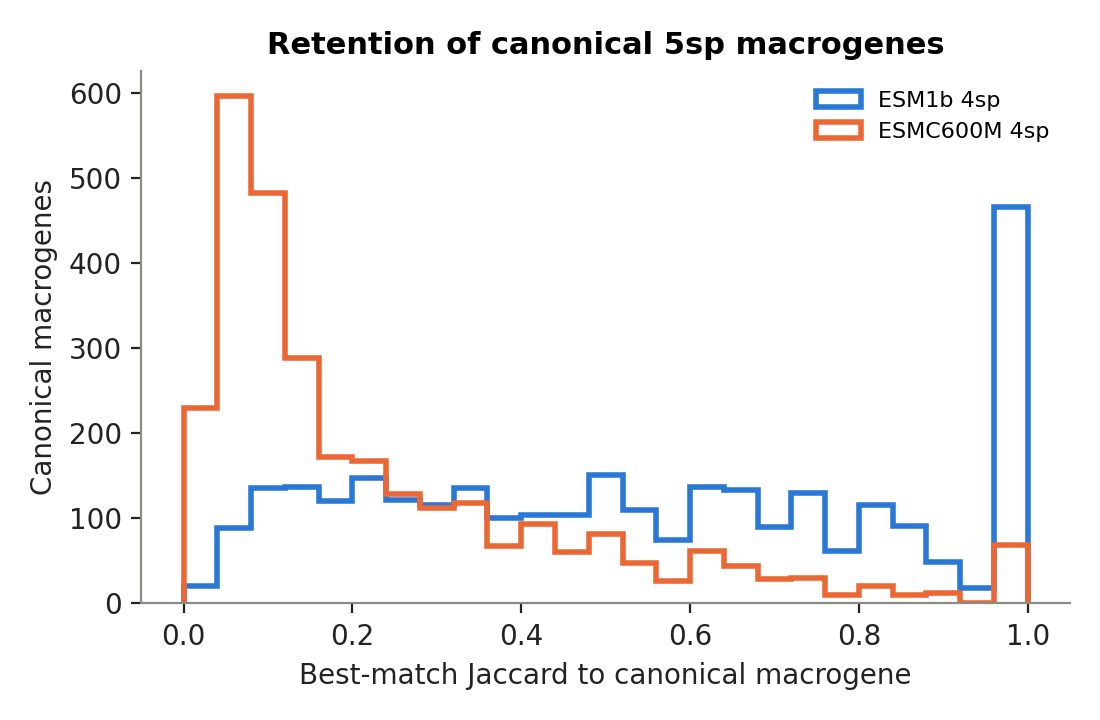
- Canonical macrogenes don’t survive under ESMC (Figure 2). Of the 519 canonical macrogenes containing all 5 species, 242 stay intact (best-match Jaccard ≥ 0.5) with ESM-1b 4sp and only 56 with ESMC.
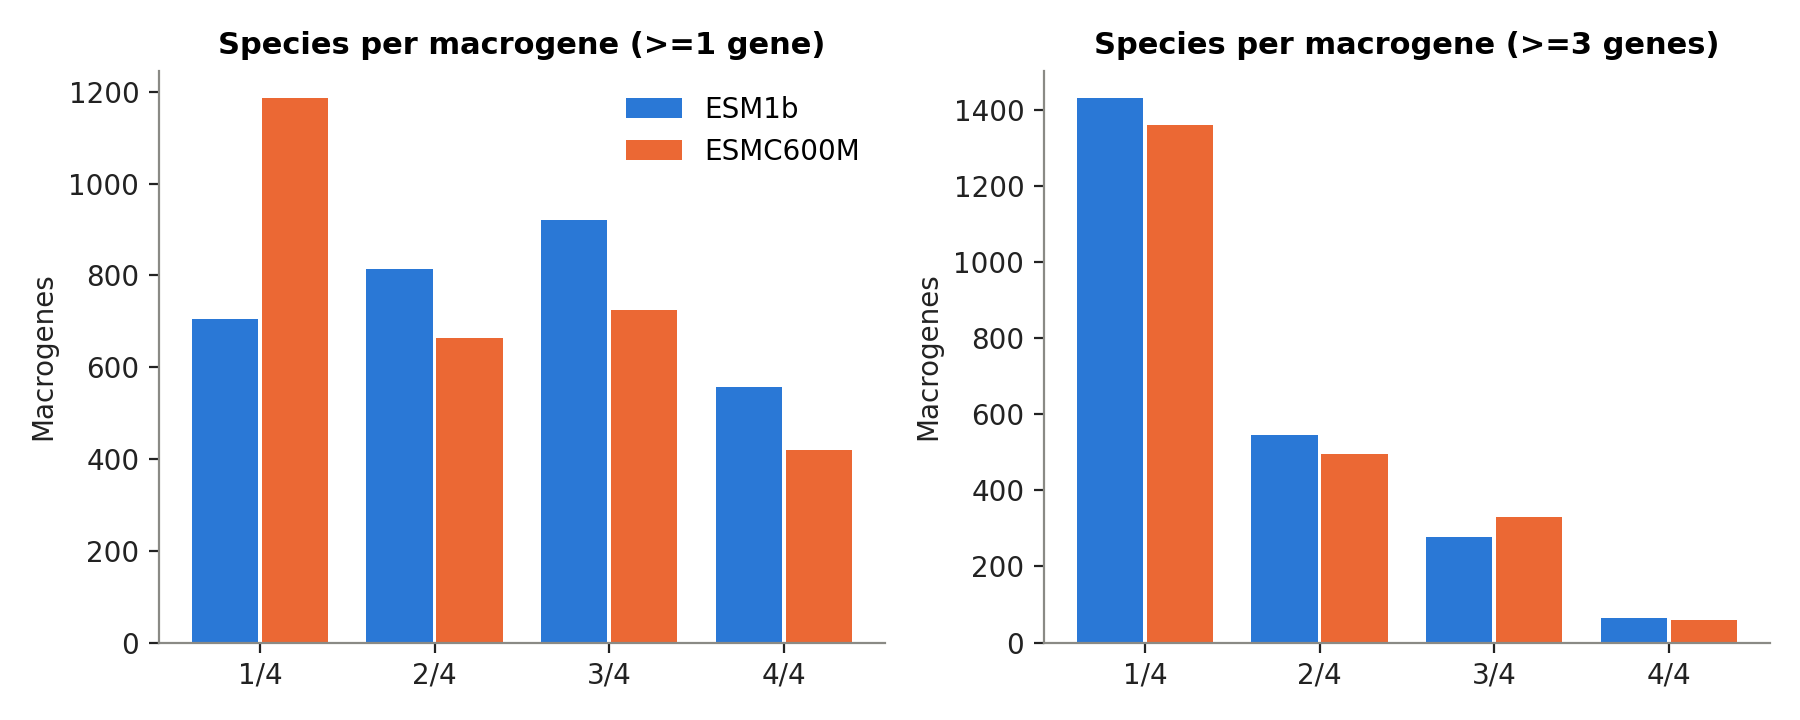
- ESMC splits species apart (Figure 1). 1,187 single-species macrogenes vs 706, 420 four-species vs 556, and 340 one-gene macrogenes vs 74. Drer is hit hardest (genes in single-species macrogenes: 2,545 → 3,459).
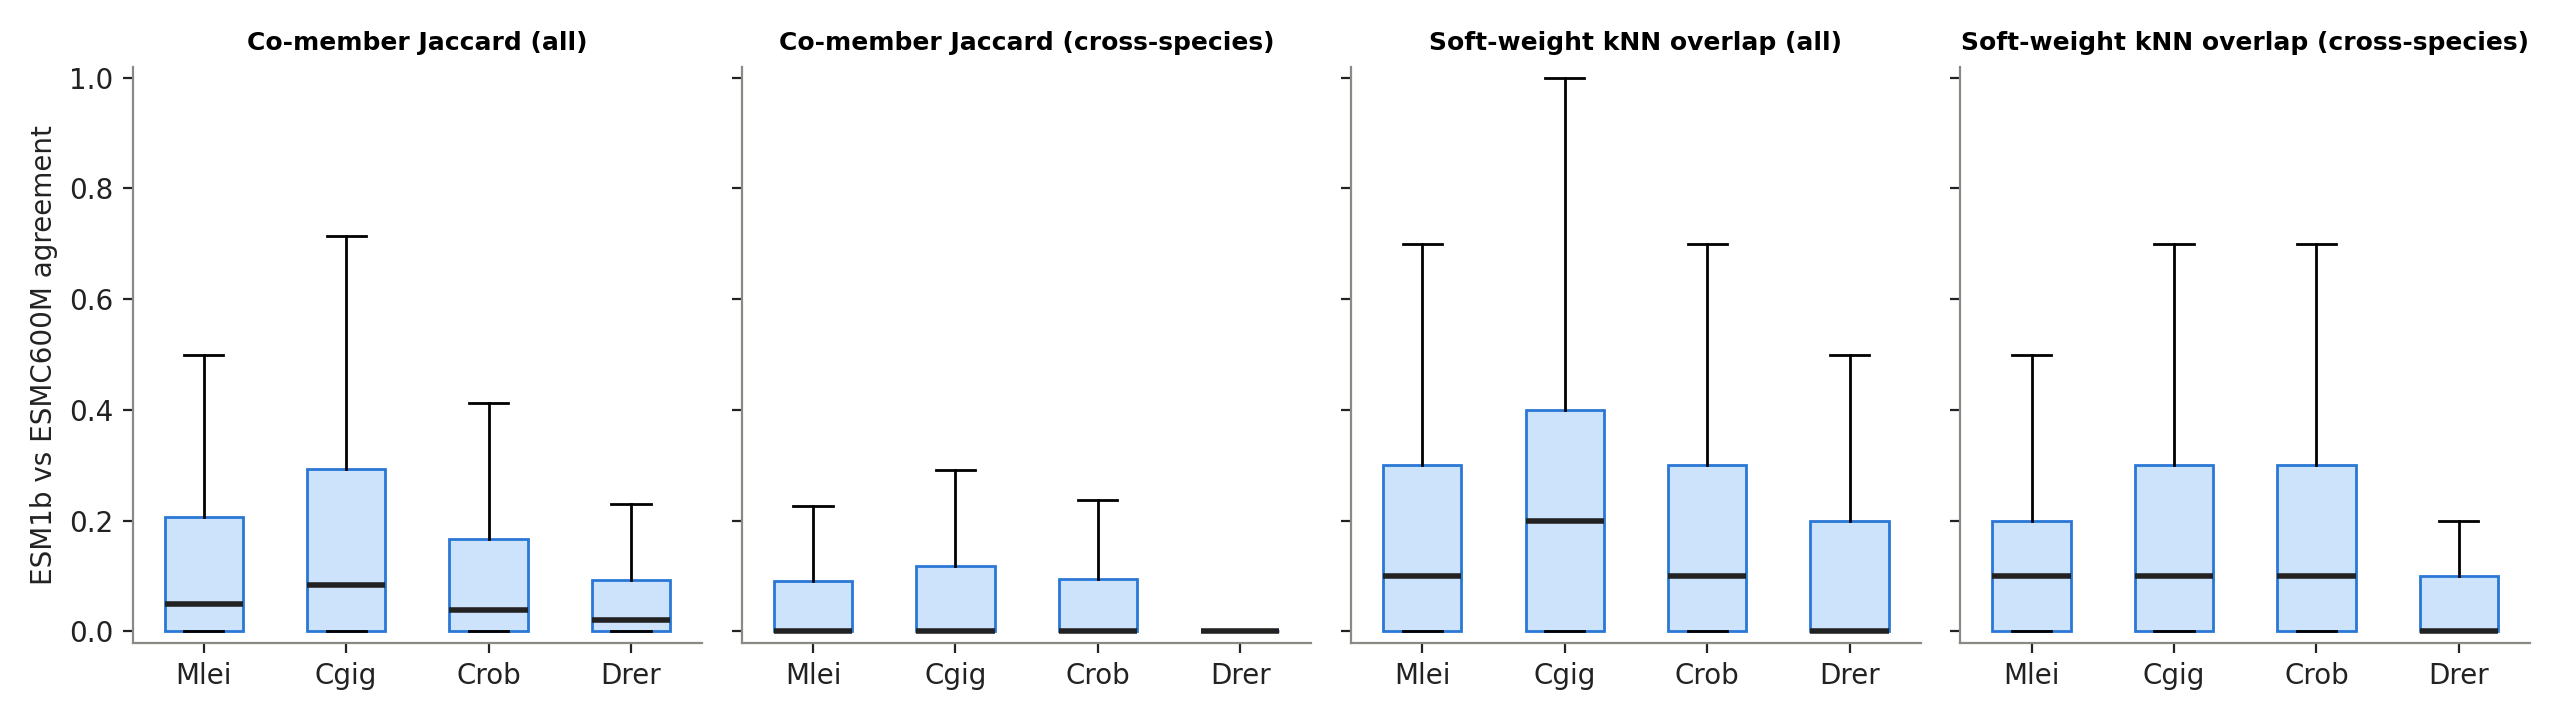
- Individual genes mostly change partners (Figure 3). Most genes share few macrogene partners between the two runs, in every species.
- My marker macrogenes are fragile under both models. Canonical MG1089 (24 genes) keeps at most 6 genes together in either 4sp run; MG2003 keeps 13/39 with ESM-1b and 3/39 with ESMC.
2. Raw embedding check: the Drer conversion is fine, vector length is not
Checked the exact .pt files SATURN used, on the same genes.
- Drer gene→protein bridge is OK. Within-species neighbour agreement between models is 0.27 for Drer vs 0.37–0.46 for the others (random = 0.001). A broken bridge would sit near zero. Duplicate vectors match across models (they come from the shared gene→protein mapping, not the conversion).
- 10 Drer HV genes differ only in upper/lower case between the h5ad and the ESM-1b file (e.g.
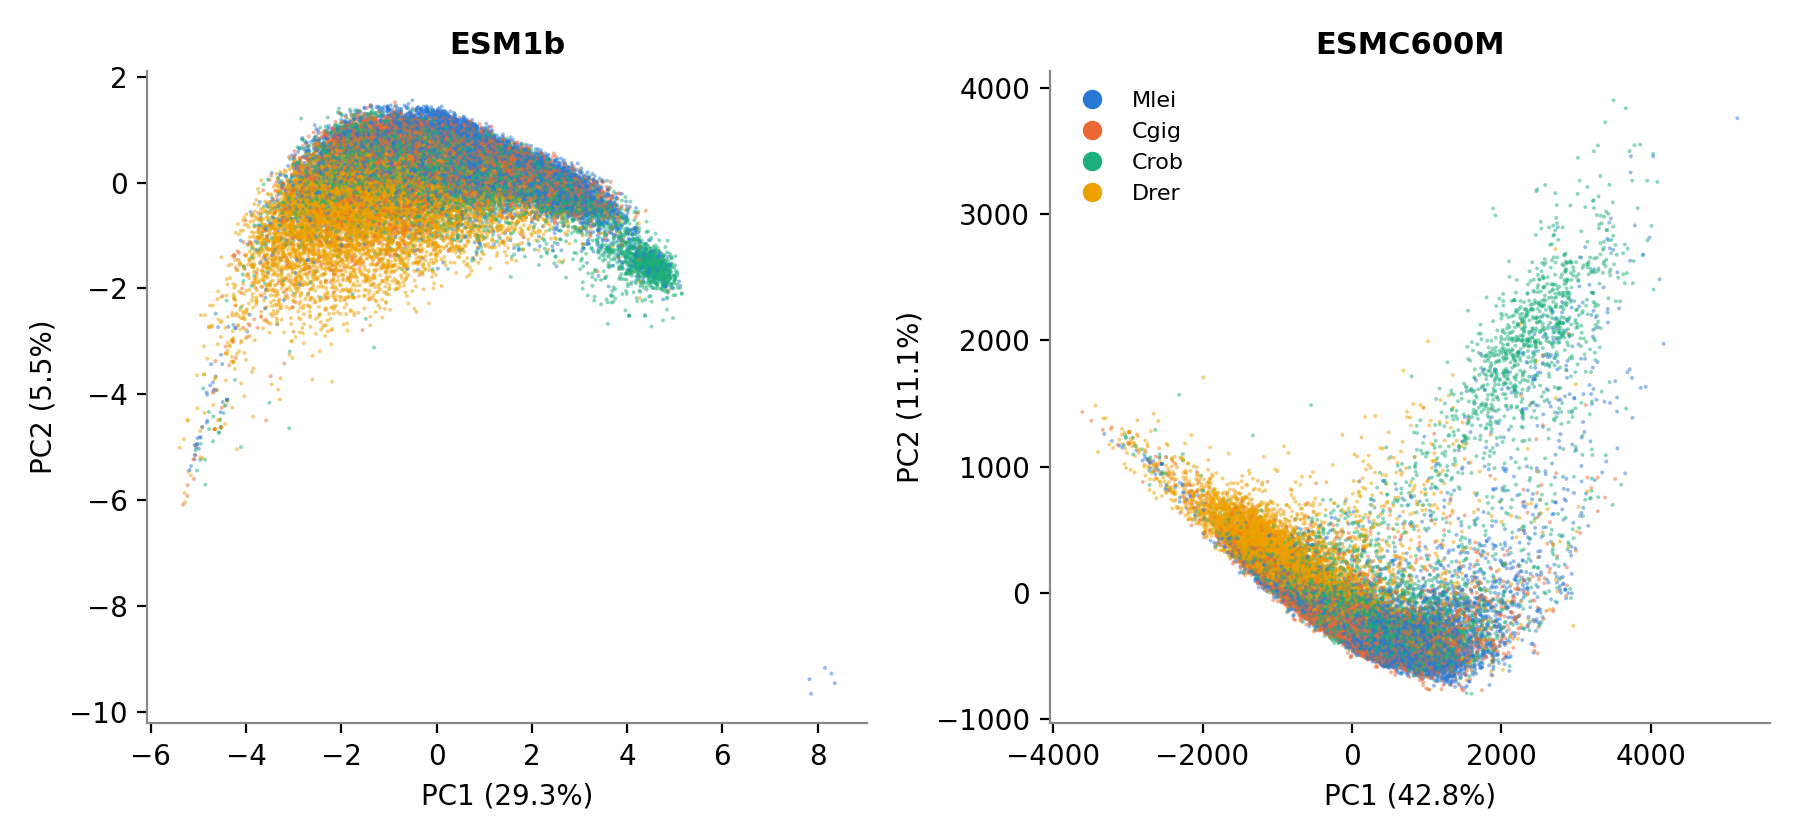
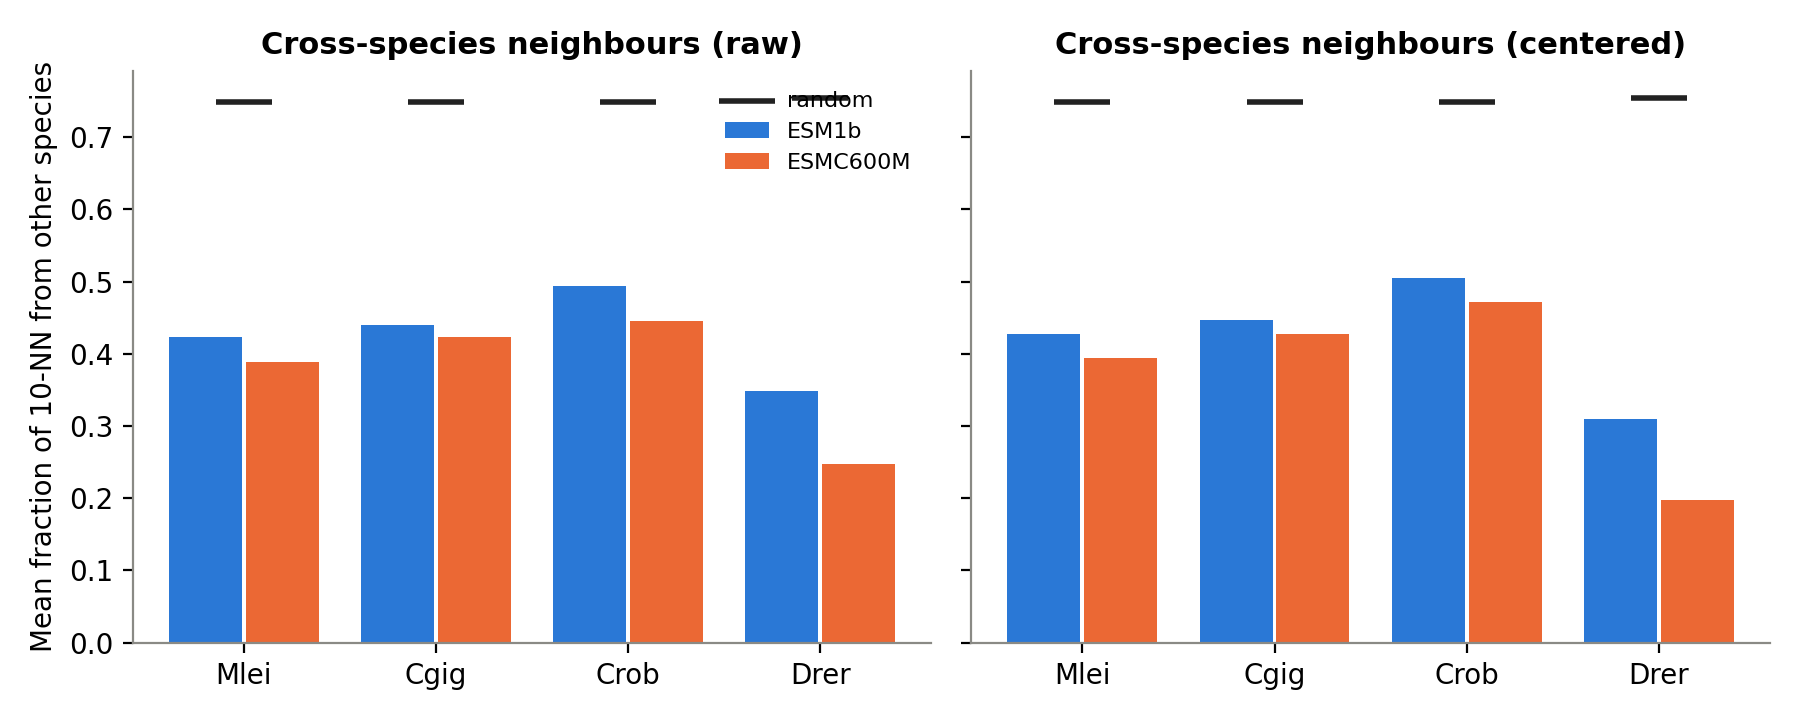
AP1S2,clpb); case-insensitive matching resolves all of them in both models (these are the ~10 “unmapped” Drer genes noted before). - ESMC separates Drer more, even by direction alone (Figure 4, Figure 5). After removing the global mean, 20% of a Drer gene’s 10 nearest neighbours are from other species with ESMC vs 31% with ESM-1b (random ≈ 75%). Variance explained by species: 0.12 (ESMC) vs 0.07 (ESM-1b).
- Vector length is the bigger problem (Table 4). ESM-1b lengths vary ~2%; ESMC lengths vary about 5-fold between genes, and Drer is systematically shorter.
| Mean L2 norm (HV genes) | Mlei | Cgig | Crob | Drer |
|---|---|---|---|---|
| ESM-1b (1280-dim) | 17.5 | 17.6 | 17.6 | 17.8 |
| ESMC-600M (1152-dim) | 3,659 | 3,297 | 3,630 | 2,833 |
L2 norm = the length of a vector, √(v₁² + v₂² + … + vₙ²) over all its dimensions (e.g. the vector (3, 4) has length 5). The mean L2 norm is that length averaged over all genes of a species. An embedding’s direction carries the protein information (similar proteins point the same way); its length mostly reflects how it was extracted. Euclidean distance, which SATURN’s KMeans uses, depends on both.
3. Why length matters: SATURN does not normalize gene embeddings
Checked ~/SATURN on Pegasus:
train-saturn.py:X = torch.cat([species_to_gene_embeddings[...]])→make_centroids(X, ...)with nonormalize=argument.model/saturn_model.py::make_centroids(..., normalize=False)→KMeans(...).fit(embeds)(Euclidean) →default_centroids_scoresranks each gene’s distance to every centroid and turns ranks into starting weights (log1p(1/rank)^2 * 2).data/gene_embeddings.py: no normalization on load.- The
F.normalizeat line 89 is on the cell embeddings during training, not gene embeddings. The built-innormalize=Truedivides by the row sum, which isn’t meaningful for signed embeddings.
So with ESMC, long vectors dominate the Euclidean KMeans that seeds the macrogenes. This likely explains the 340 one-gene macrogenes and the extra Drer isolation (Figure 1).
The rescaling fix (05e, run in progress)
What it does: every ESMC gene vector is divided by its own length (making it length 1) and then multiplied by one fixed number, the average ESM-1b vector length (~17.6, calculated from the ESM-1b files). In symbols: v → v / ‖v‖ × 17.6.
- What changes: only the length. Every gene now has the same length, on the same scale as ESM-1b.
- What stays the same: the direction of every vector, so which genes point the same way (cosine similarity, the protein information the model encodes) is untouched.
- Why this works for SATURN: for vectors of equal length, Euclidean distance depends only on the angle between them, so KMeans then groups genes by direction alone, as it effectively already does for ESM-1b (whose lengths vary only ~2%).
- Bookkeeping: originals stay in
03_embeddings_ESMC600M/; rescaled copies go to03_embeddings_ESMC600M_rescaled/. ESM-1b is left as is. The run uses a fresh run directory so SATURN can’t reuse the old centroids (see Hurdles).
Comparing ESM-1b with rescaled ESMC is the fair test of the two models. If the rescaled run looks like ESM-1b on the length checks below, the extra length-grouping in the raw run was an extraction artifact; if it still looks like the raw run, ESMC’s directions themselves carry that signal.
4. Does vector length explain the ESMC macrogenes?
05h uses each gene’s raw ESMC vector length as the x-axis and compares the ESM-1b run (control: built without ESMC) with the raw-ESMC run, on the 31,808 shared genes. Length deciles are computed within each species, so Drer’s shorter vectors don’t show up as a length effect. The rescaled-ESMC run will be added when it finishes.
05h).
| ESM-1b 4sp | ESMC raw 4sp | |
|---|---|---|
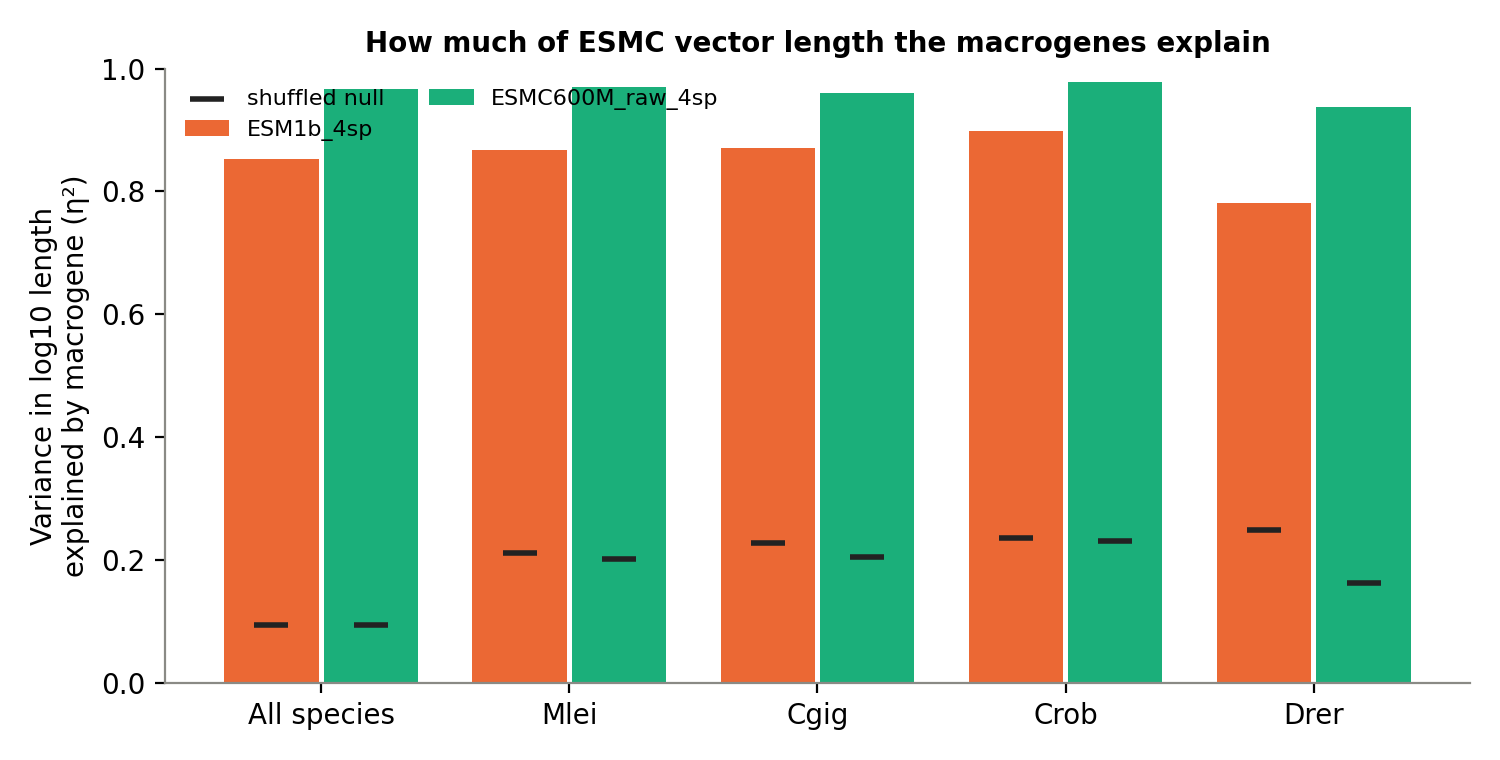
| Variance in log10 length explained by macrogene (η²; shuffled null ≈ 0.09) | 0.85 | 0.97 |
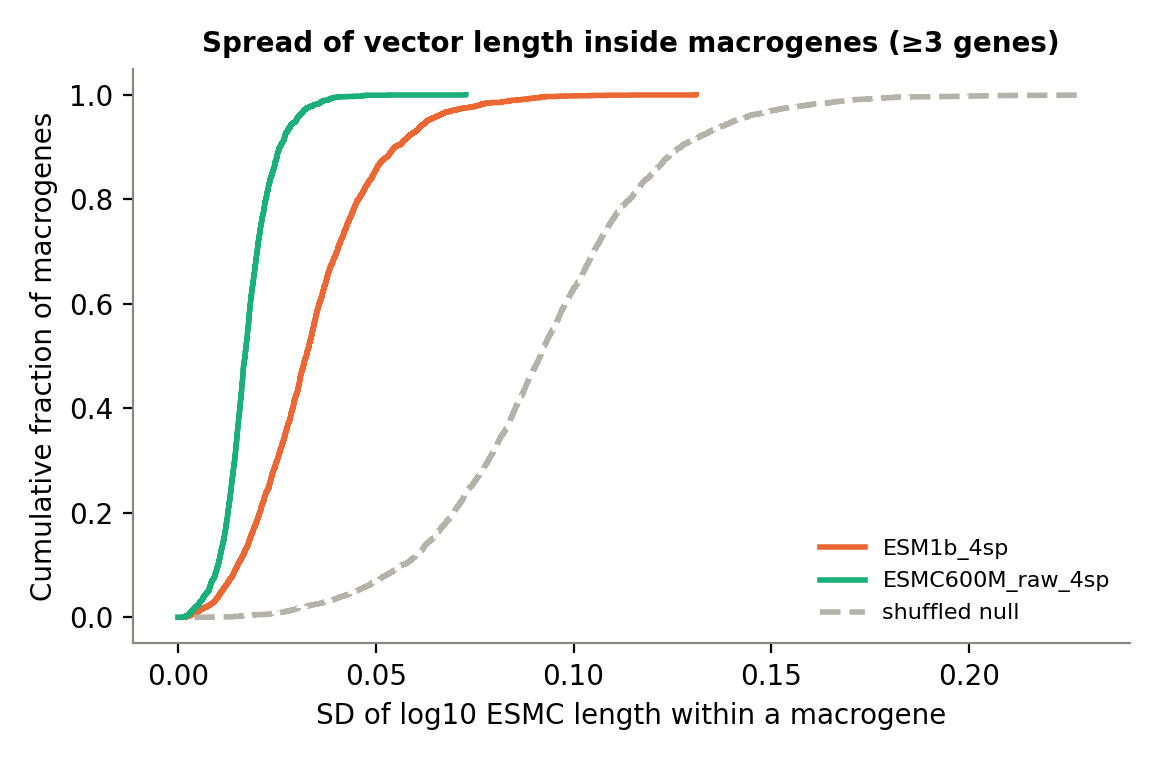
| Median within-macrogene SD of log10 length, relative to shuffled | 0.36 | 0.18 |
| Drer η² above its null | 0.53 | 0.78 |
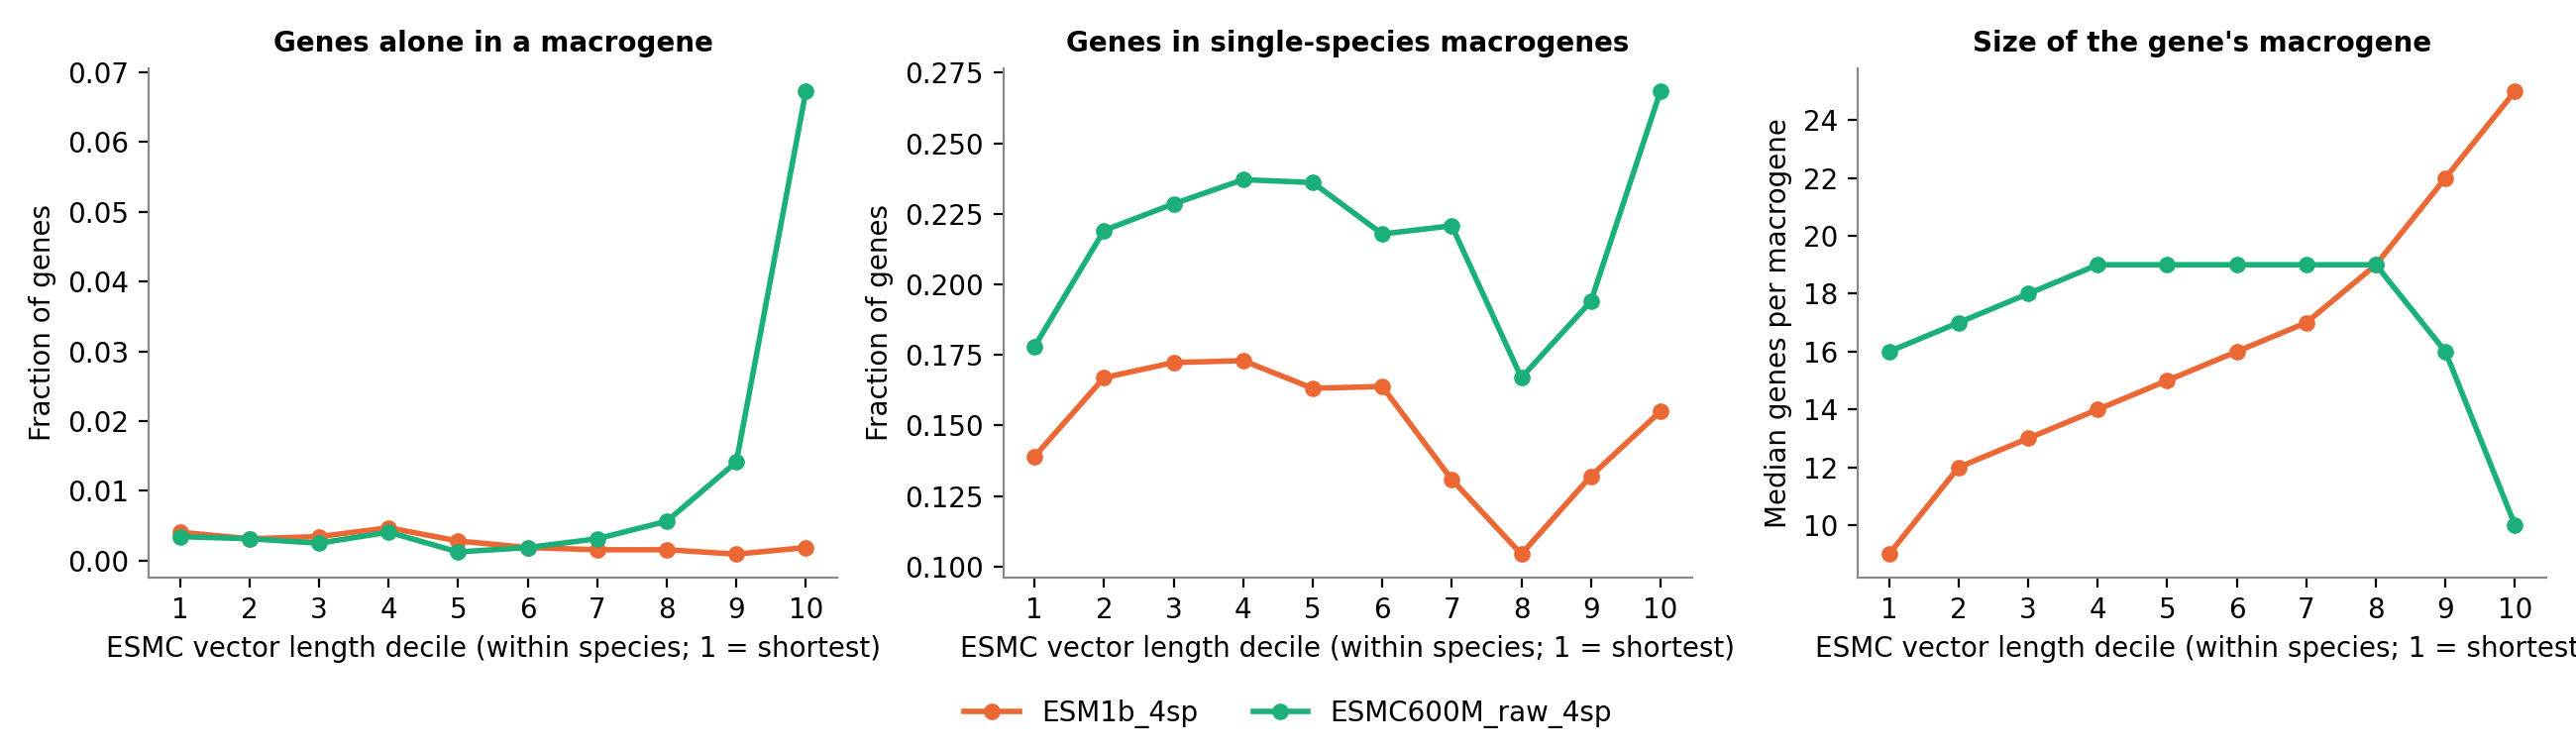
| Genes alone in a macrogene, longest 10% | 0.2% | 6.7% |
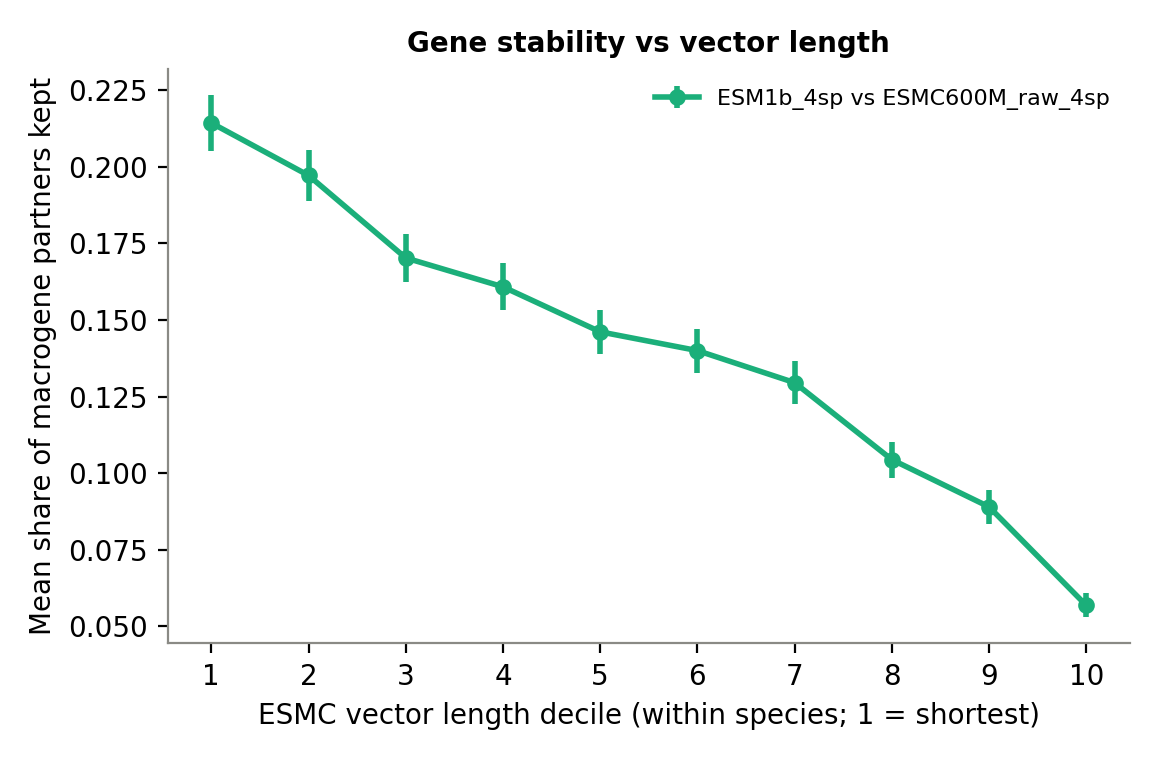
| Share of macrogene partners kept vs ESM-1b, shortest → longest 10% | — | 0.21 → 0.06 |
- ESMC length is not random noise; it follows protein similarity (Figure 7). Even ESM-1b’s macrogenes, built without ESMC, explain 85% of the variation in ESMC length (null 9%): genes that ESM-1b groups together (similar proteins) also have similar ESMC lengths. Length probably tracks protein properties such as protein length or family. So “similar lengths within a macrogene” alone can’t separate grouping-by-length from grouping-by-similarity.
- Raw ESMC still groups by length beyond that (Table 5, Figure 8). Its macrogenes are about twice as uniform in length as ESM-1b’s (within-macrogene spread 18% vs 36% of shuffled), and the gap is largest for Drer.
- The longest vectors end up alone and move the most (Figure 6, Figure 9). In the top length decile, 6.7% of genes sit in one-gene macrogenes with raw ESMC vs 0.2% with ESM-1b; the bottom 80% look the same. The share of macrogene partners shared between the two runs falls steadily from 0.21 (shortest) to 0.06 (longest). This fits Euclidean KMeans pulling far-out long vectors into their own clusters.
- Within-species length rank doesn’t explain single-species macrogenes. Raw ESMC has more single-species macrogenes at every decile, not just the long end (Figure 6, middle). Drer’s isolation may come from its vectors being shorter overall (removed here by ranking within species) or from ESMC’s directions (section 2).
Interpretation so far: vector length clearly shaped the raw-ESMC macrogenes, especially for the longest vectors, but it isn’t the whole story. The rescaled run will show how much is left once length is removed.
5. How the model will be chosen (next entry)
Agreement with ESM-1b only shows how different ESMC is, not which is better. The decision uses references independent of both models:
- Gene level (
05g, cheap): eggNOG Metazoa-level orthologous groups (OGs) across 4 runs (canonical 5sp without Spur, ESM-1b 4sp, ESMC raw 4sp, ESMC rescaled 4sp).- recall = OG pairs (different species) placed in the same macrogene / all OG pairs
- precision = co-assigned cross-species pairs sharing an OG / co-assigned pairs where both genes have an OG
- compared with a null from shuffling macrogene labels within species; reported for all species pairs and for Mlei pairs separately
- eggNOG gene→OG table:
output/Eggnog/ALL4_gene_protein_metazoaOG_slim.csv(HV genes with a Metazoa OG: Mlei 50%, Cgig 63%, Crob 63%, Drer 99%)
- Cell level (expensive): full SATURN training on the best one or two, judged on cross-species cell-type mixing and label transfer.
05f also produces embedding stats to share with Ingrid: vector length per species, vector length vs protein length (tests mean vs sum pooling), effective dimensionality, species separation, and nearest-neighbour ortholog recovery before SATURN.
Hurdles and fixes
- Conda +
set -uin LSF jobs:set -euo pipefail+source ~/anaconda3/bin/activateexits instantly (conda reads unset$PS1). Wrap the two activation lines inset +u/set -u. bmodcan’t extend walltime: my account has two LSF projects;bmod -Wdemands-Pbut rejects-Pon a running job. Fix: kill, set#BSUB -W 72:00in the script, resubmit.- Node speed varies ~6x:
gpu1ran pretraining at ~102 s/epoch;n051andn131at ~630 s/epoch. For full 72 h runs, pin with#BSUB -m gpu1. - SATURN silently reuses centroids: if
centroids_init.pklexists in the run directory, it is loaded and KMeans is skipped.05b2now refuses to start if one exists; always use a fresh run directory when inputs change. - Case-sensitive gene names: a few Drer symbols differ in case between files; scripts now match exactly first, then case-insensitively.
Next steps
Questions for Ingrid Miranda Perez
About the FANTASIA v4 ESMC-600M embeddings (HDF5 files, type_5/layer_0/embedding, 1,152-dim):
- Layer: which layer is
layer_0: the final transformer layer, or counted from the first? Are other layers available in the files? - Normalization: is
layer_0taken before or after ESMC’s final normalization layer? The vectors we received have lengths of ~1,700–8,900 (ESM-1b, taken after its final normalization, gives ~16–20), which suggests pre-normalization hidden states. - Pooling: are per-residue vectors averaged over the protein (with start/end tokens excluded, as the FANTASIA v3 release notes describe), or summed? Any weighting?
- Post-processing: is any L2 normalization or standardization applied before writing the HDF5?
- Long proteins: how are proteins longer than ESMC’s 2,048-token context handled (truncated, split into windows, skipped)?
- Exact setup: FANTASIA version and config file, ESMC checkpoint name, and precision (fp32 / fp16 / bf16), so the methods section can cite them exactly.
- Input proteomes: which FASTA files and isoforms were embedded for each species? We average isoforms per gene; does FANTASIA recommend the longest isoform or a canonical one instead?
- Expected behaviour: in FANTASIA’s own GO transfer, are distances computed on raw or normalized vectors? Have you seen ESMC lengths vary this much, or Danio vectors run systematically shorter (median ~2,800 vs ~3,300–3,700 for the invertebrates)?
- Re-extraction: if the current vectors are pre-normalization, could you re-export the same proteins from the final normalized layer (or mean-pooled after the final norm), so we can compare with our rescaling fix?
References
- Rives A. et al. (2021) Biological structure and function emerge from scaling unsupervised learning to 250 million protein sequences. PNAS 118:e2016239118.
- ESM Team / EvolutionaryScale (2024) ESM Cambrian. Model card: https://huggingface.co/multimolecule/esmc-600m
- FANTASIA: https://github.com/CBBIO/FANTASIA (release notes: https://github.com/CBBIO/FANTASIA/releases)
- Timkey W., van Schijndel M. (2021) All bark and no bite: rogue dimensions in transformer language models obscure representational quality. EMNLP 2021. https://aclanthology.org/2021.emnlp-main.372
- Sun M., Chen X., Kolter J.Z., Liu Z. (2024) Massive activations in large language models. COLM 2024. https://arxiv.org/abs/2402.17762
- Beshkov K., Malthe-Sørenssen A. (2025) Towards understanding the shape of representations in protein language models. https://arxiv.org/abs/2509.24895
- Hakim et al. (2025) A look at the isotropy of pretrained protein language models. https://arxiv.org/abs/2510.10655
- Pool PaRTI: a PageRank-based pooling method for protein sequence representations. https://www.ncbi.nlm.nih.gov/pmc/articles/PMC11956911/
- Aggregating residue-level protein language model embeddings with optimal transport. https://www.ncbi.nlm.nih.gov/pmc/articles/PMC11961220/
- Schakel A.M.J., Wilson B.J. (2015) Measuring word significance using distributed representations of words. https://arxiv.org/abs/1508.02297
- Rosen Y. et al. (2024) Toward universal cell embeddings: integrating single-cell RNA-seq datasets across species with SATURN. Nature Methods 21:1492–1500.