SATURN: preparing the human and fly immune datasets for the pLM benchmark
- Why: the protein language model (pLM) benchmark panel is now Mnemiopsis, oyster, Ciona and zebrafish (urchin dropped). Two well-annotated reference species, human and Drosophila, are being added as immune datasets.
- Fly: circulating hemocytes from healthy, not-infested late-L3 larvae (Cattenoz et al. 2020, 10x 3’). 7,517 cells, author cluster labels.
- Human: the CellTypist cross-tissue immune atlas (Domínguez Conde et al. 2022), 10x 3’ v3 donors only, myeloid compartment plus mast cells, T/B/NK cells, and (revised the same day) progenitors and erythroid cells, so that every zebrafish cell type in the earlier SATURN run has a human counterpart. 10,541 cells in the first build; the revised build adds 1,000 progenitors and 78 erythroid cells, for 11,619 cells (job 599517).
- Proteomes: Ensembl release 113 for both (same release as zebrafish). Links in Proteomes (also what Ingrid needs for ESMC).
- Status: SATURN inputs built; ESM-1b embeddings running on Pegasus (jobs 599440 Dmel, 599441 Hsap). The human h5ad will be rebuilt with the revised composition; the embeddings are unaffected because the gene list does not change.
- Update 2026-10-16 (QC,
07f): both inputs are clean and the author labels match canonical markers; no cells removed. Human is ~3× deeper than the other species, and donor is confounded with cell type for several human groups. Three decisions open (human label granularity, human depth, small fly groups). See Section 5.
Key terms
| Term | Meaning here |
|---|---|
| Hemocytes / plasmatocytes | Fly blood cells. Plasmatocytes are the phagocytic, macrophage-like majority; crystal cells (CC) and lamellocytes (LM) are minor types. |
| L3 / wandering L3 | Third (last) larval stage; “wandering” larvae have left the food, shortly before pupation. |
| 10x 3’ v3 / 5’ v1–v2 | 10x Chromium library chemistries. 3’ and 5’ kits capture different ends of each transcript, so they are not mixed within a species here. |
raw.X |
Where CELLxGENE h5ad files keep the raw integer counts (X holds normalised values). |
| Isoform | One protein product of a gene. Ensembl pep.all lists every isoform; SATURN combines isoform embeddings into one gene embedding. |
1. Datasets used
| Species | Dataset | What | Chemistry | Accession |
|---|---|---|---|---|
| Drosophila melanogaster (Dmel) | Cattenoz et al. 2020, EMBO J | circulating hemocytes, not-infested (NI) wandering L3 larvae, OregonR, pool of 20 females | 10x 3’ | ArrayExpress E-MTAB-8698 (library RRCZ22; Cell Ranger matrices + author labels NI_cell_cluster_ID.txt) |
| Homo sapiens (Hsap) | Domínguez Conde et al. 2022, Science (CellTypist) | immune cells isolated from 16 tissues of organ donors; myeloid compartment + global object | 10x 3’ v3 subset (also 5’ v1/v2 in the full atlas) | CELLxGENE collection 62ef75e4: Myeloid compartment (51,552 cells), Global (329,762 cells) |
Why these. Both are whole-cell 10x data from healthy animals or donors, matching the other species. Cattenoz uses late (wandering) L3 larvae: in a cross-species comparison, late-larval plasmatocytes were the hemocytes most similar to vertebrate macrophages (Yoon et al. 2023), which gives SATURN an expected answer to check. CellTypist covers tissue-resident macrophages (lung, gut, spleen), not just blood monocytes, with expert-curated labels.
2. Download and inspection (07b, 07c)
07b downloads both datasets on the transfers queue (md5 checks pass for both Cattenoz archives). 07c is a read-only diagnostic.
Fly. 7,606 cells × 13,926 genes, all FlyBase FBgn IDs, integer counts. Median 2,930 UMIs, 959 genes and 4.9% mitochondrial reads per cell. 7,517 barcodes have an author label; the 89 unlabelled cells have a median of only 352 genes (vs 961) and were dropped as low-quality.
Human. Raw integer counts are in raw.X for both files, and labels agree 100% between the Myeloid and Global objects. Only 2 of the 12 donors (D496, D503) were sequenced with 3’ v3; the other 10 are 5’. Restricting to 3’ v3 leaves 34,863 myeloid cells, dominated by classical monocytes (16,047) and alveolar macrophages (13,869, almost all lung). Smaller macrophage types: intestinal 484, intermediate 321, erythrophagocytic 77. No liver (Kupffer) cells and no neutrophils on 3’ v3. Mast cells (3,110) are in the Global object, not the Myeloid one.
3. Building the SATURN inputs (07d)
Same format as 01_prepare_h5ads.sh: raw counts in X (CSR), obs['cell_type'] and obs['species'], written to 02_processed_h5ad/{Dmel,Hsap}_saturn.h5ad. Cell names are prefixed Dmel_ / Hsap_ so barcodes cannot collide across species. Extra obs columns (tissue, donor_id, sample_group) are kept for interpretation; SATURN reads only cell_type.
- Fly: the 7,517 labelled cells;
cell_type= author cluster. - Human:
cell_type=Manually_curated_celltype; subsampled (seed 42) so the rare macrophage types are not swamped:- kept in full: nonclassical monocytes, intestinal / intermediate / erythrophagocytic macrophages, DC1, DC2, migDC, cycling;
- classical monocytes: 600 each from blood, spleen, bone marrow and lung;
- alveolar macrophages: 2,400;
- mast cells: 500, the only granule-storing (granulocyte-like) human cells available, as a comparison for granular invertebrate cells (e.g. the eosinophil-like Mlei_16). Treated as supporting evidence only;
- lymphocyte slice: ~286 each of CD4 T, CD8 T, γδ T, MAIT, NK, B and plasma cells, as counterparts of the zebrafish T and B cells (first planned as a negative control);
- added in the revision: all 3’ v3 progenitors and erythroid cells, each capped at 1,000 (counterparts of zebrafish HPC / myeloid progenitors and erythroid cells);
- dropped: doublets, megakaryocytes and other minor lymphoid states.
Why mirror the zebrafish cell types (revision). In the earlier zebrafish / Ciona / Mnemiopsis SATURN run, the zebrafish input included macrophages, neutrophils, eosinophils, HPC, myeloid progenitors, T cells, B cells and erythroid cells. Zebrafish and human are the closest pair in the panel, so each zebrafish type should have a human counterpart to land with; if they do not co-cluster, the more distant matches cannot be trusted. Erythroid cells also serve as a check: in that run, zebrafish erythroid cells merged with a Ciona progenitor-like population (cLRP-1), which cannot be a homologous cell type. The new cells are sampled after all earlier picks (same seed), so the original 10,541 cells are unchanged. Remaining gap: no human neutrophils or eosinophils on 3’ v3 (mast cells are the nearest granulocyte-like cells), and only 78 erythroid cells.
02_processed_h5ad/Dmel_Hsap_prep_composition.csv); the progenitor and erythroid row is added by the revised 07d.
| Species | Group | Cell types (n cells) | Total |
|---|---|---|---|
| Dmel | hemocytes | PL-0 1,472; PL-1 1,327; PL-2 1,322; PL-Rel 946; PL-3 685; PL-robo2 489; PL-Pcd 351; PL-vir1 336; PL-Inos 234; PL-Lsp 196; CC 45; PL-prolif 44; PL-AMP 41; PL-ImpL2 21; LM-1 6; LM-2 2 | 7,517 |
| Hsap | myeloid, kept in full | nonclassical monocytes 909; cycling 804; intestinal macrophages 484; DC2 432; intermediate macrophages 321; DC1 133; migDC 79; erythrophagocytic macrophages 77 | 3,239 |
| Hsap | myeloid, subsampled | classical monocytes 2,400; alveolar macrophages 2,400 | 4,800 |
| Hsap | mast cells | mast cells 500 | 500 |
| Hsap | lymphocytes | CD4 T 286; CD8 T 286; γδ T 286; MAIT 286; NK 286; B 286; plasma 286 | 2,002 |
| Hsap | progenitors, erythroid (revision) | Progenitor 1,000 (of 1,136 on 3’ v3); Erythroid 78 | 1,078 |
| Hsap 11,619 (10,541 in the first build + 1,078) |
4. Proteomes and embeddings (07e, 02_embed.sh)
Ensembl release 113 for both species, the same release as the zebrafish proteome:
| Species | Protein FASTA (Ensembl 113) | GTF | Proteins / genes | Pegasus copy |
|---|---|---|---|---|
| Hsap | Homo_sapiens.GRCh38.pep.all.fa.gz | Homo_sapiens.GRCh38.113.gtf.gz | 123,845 / 23,864 | /scratch/dark_genes/SATURN_Mnemi/01_proteomes/Hsap/ |
| Dmel | Drosophila_melanogaster.BDGP6.46.pep.all.fa.gz | Drosophila_melanogaster.BDGP6.46.113.gtf.gz | 30,799 / 13,986 | /scratch/dark_genes/SATURN_Mnemi/01_proteomes/Dmel/ |
Gene → protein mapping. The h5ad gene IDs are Ensembl IDs (ENSG…, FBgn…), so a new ensembl_gene_id strategy in 02_embed.sh reads the gene: field of each protein header (version suffix stripped) and maps each gene to all of its isoforms, the same as zebrafish. Only proteins of genes present in the h5ad are embedded; these are written to 03_embeddings/{Dmel,Hsap}/{SP}_filtered.faa, which is the exact protein set to use for any other model.
The filtered FASTAs (/scratch/dark_genes/SATURN_Mnemi/03_embeddings/Dmel/Dmel_filtered.faa and .../Hsap/Hsap_filtered.faa, written by step 1 of 02_embed.sh) contain exactly the proteins embedded with ESM-1b. If those are not convenient, the full Ensembl 113 pep.all files above work too: the gene ID is in the gene: field of each header.
ESM-1b settings are unchanged (esm1b_t33_650M_UR50S, layer 33, mean pooling, truncation 1,022). Both jobs run on the normal queue with 8 cores on one host and 4 GB per core.
5. Update 2026-10-16: QC and per-species UMAPs (07f)
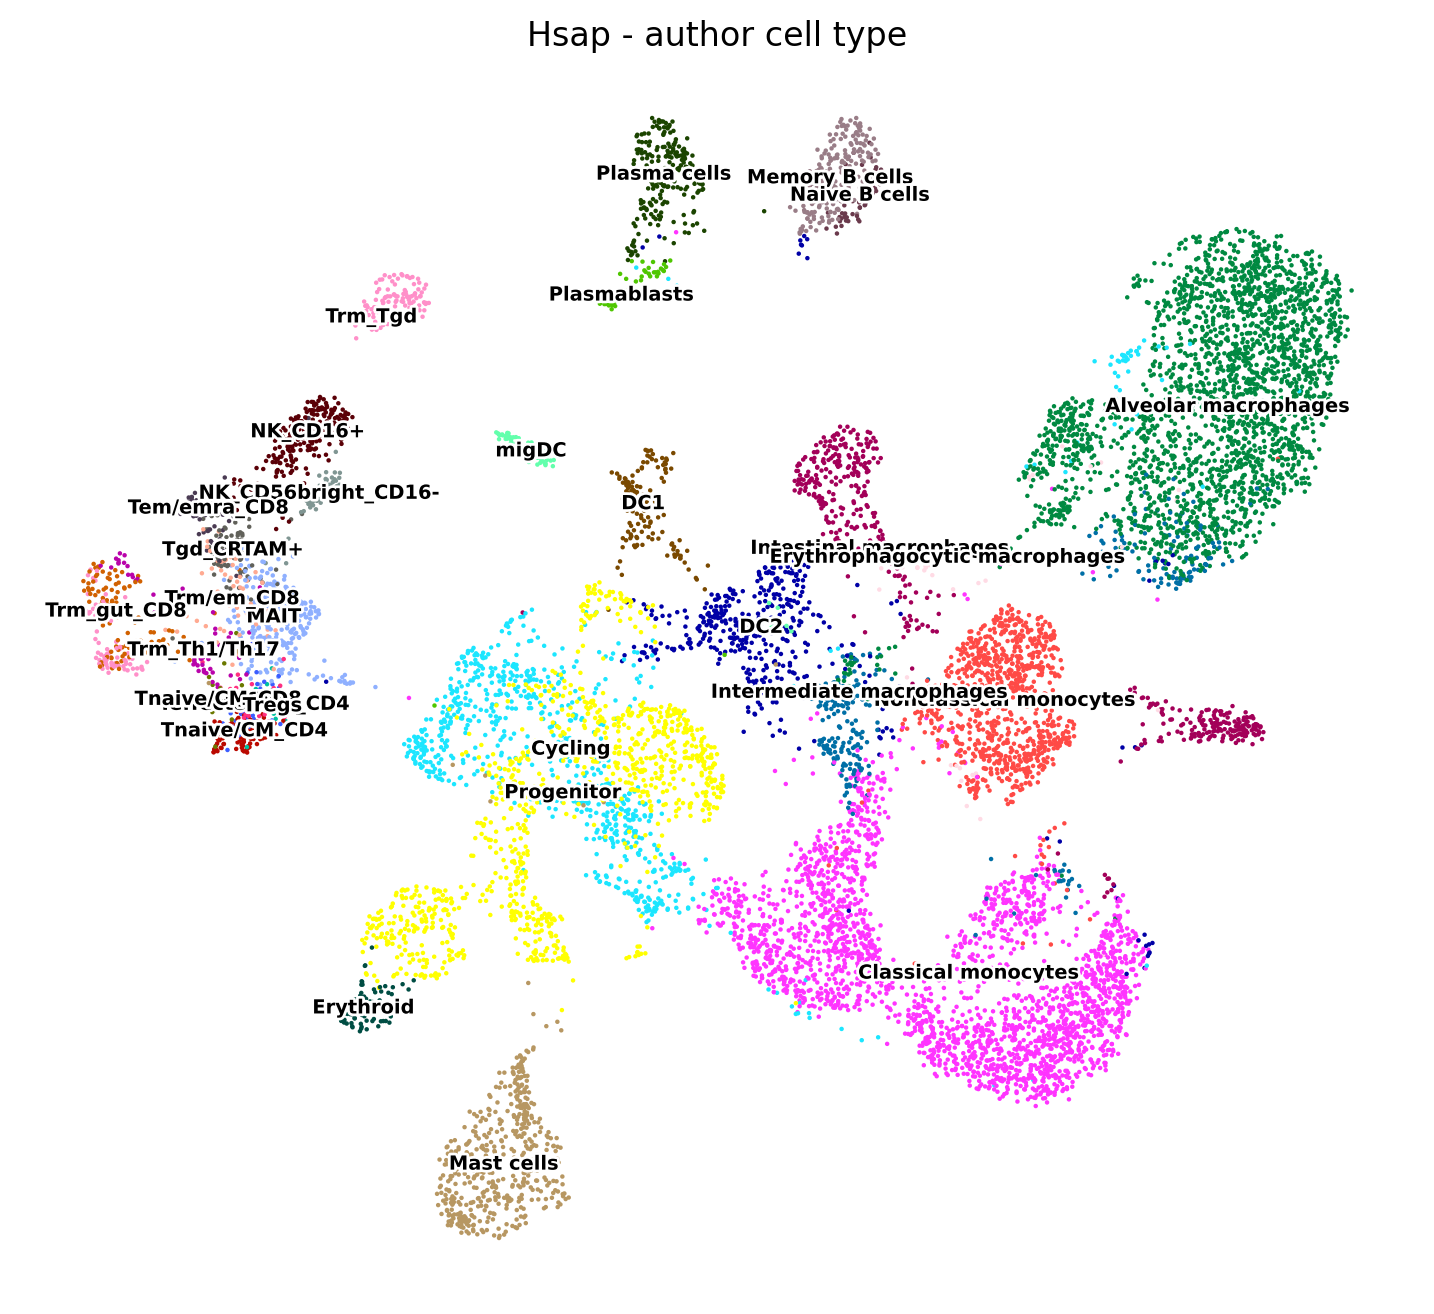
While the embeddings run, 07f_QC_UMAP_Dmel_Hsap.sh checks the quality of the two SATURN inputs and draws a UMAP for each species with the author labels. It only reads the *_saturn.h5ad files and changes nothing in them. Each species is processed on its own, with no integration and no filtering: normalise to 10,000 counts, log1p, 2,000 highly variable genes (seurat_v3), 50 PCs, 15 neighbours on 30 PCs, UMAP, and Leiden clusters at resolution 1.0 for reference only. Cells are flagged, not removed, if they lie more than 5 median absolute deviations (MADs) from the median on log UMI count or log gene count, or if their mitochondrial share is more than 3 MADs above the median.
Result: both datasets are clean, and the author labels agree with canonical markers in both species. No cells need removing.
| Species | Cells | Labels | Median UMIs | Median genes | Median % mito | Flagged |
|---|---|---|---|---|---|---|
| Mlei | 10,239 | 20 | 2,239 | 860 | – | – |
| Cgig | 37,668 | 13 | 1,947 | 757 | – | – |
| Crob | 15,575 | 33 | 6,138 | 1,494 | – | – |
| Drer | 6,532 | 9 | 3,141 | 872 | – | – |
| Dmel | 7,517 | 16 | 2,942 | 961 | 4.9 | 550 (7.3%) |
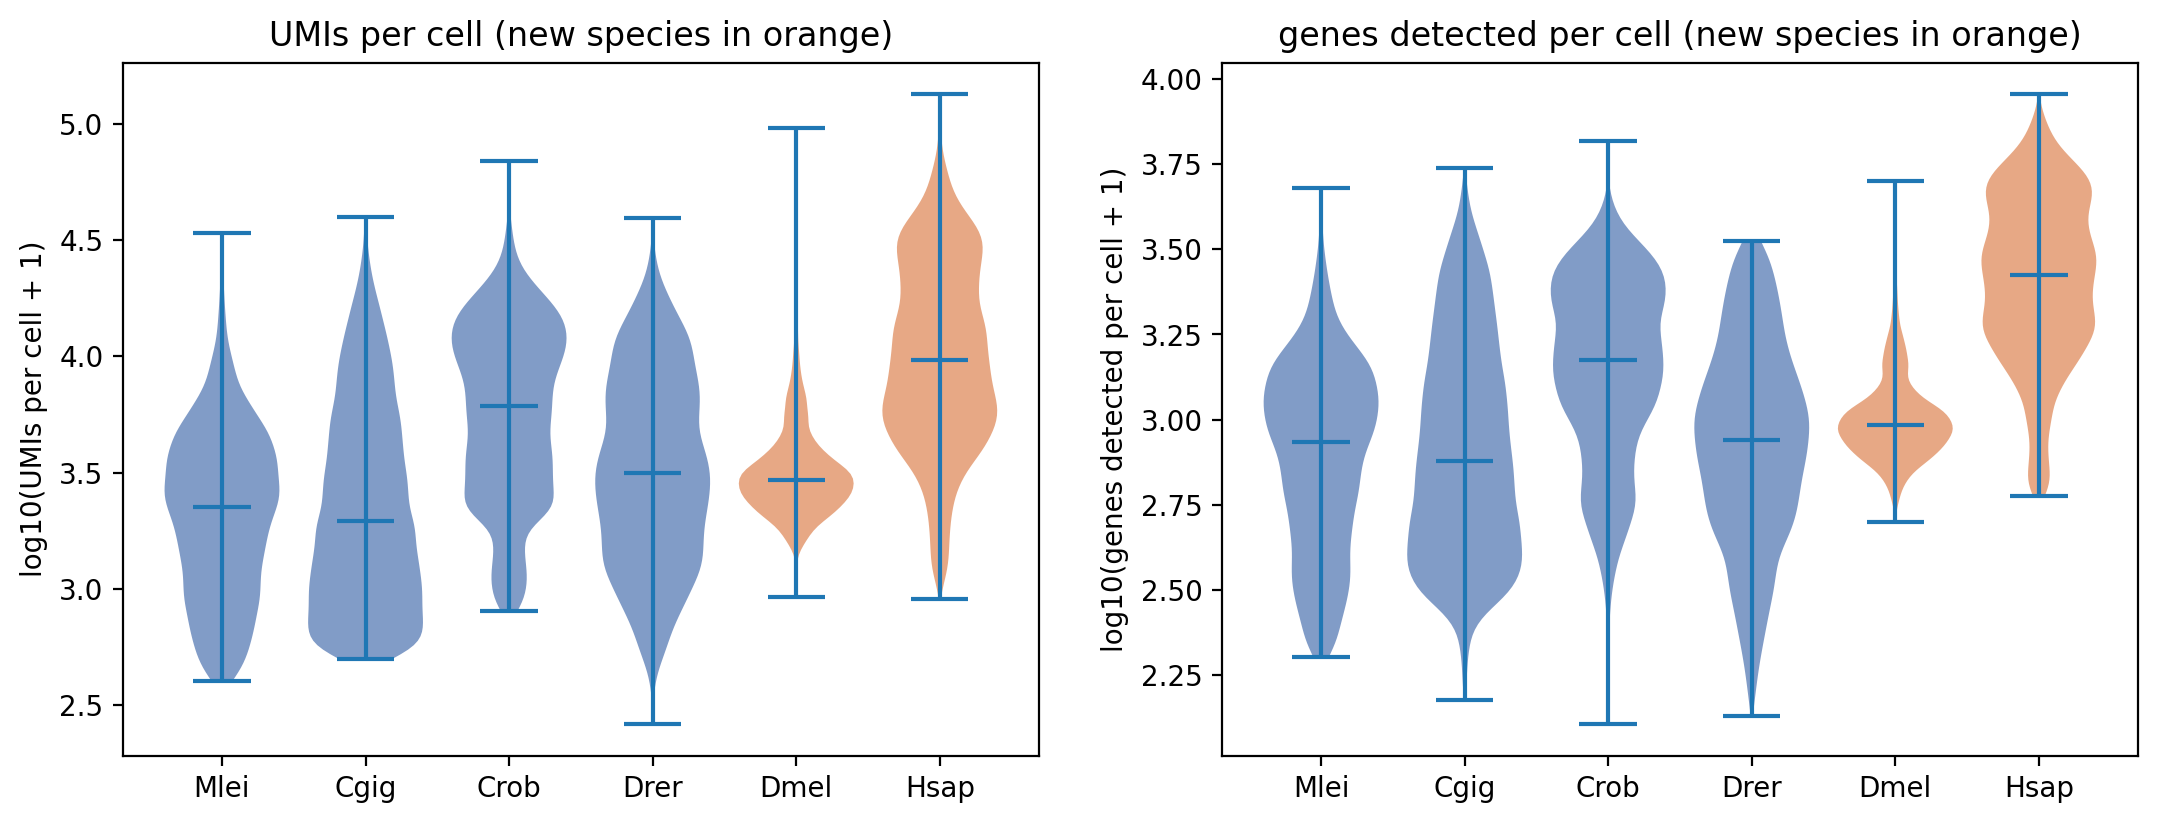
| Hsap | 11,619 | 31 | 9,604 | 2,657 | 7.4 | 962 (8.3%) |
Fly
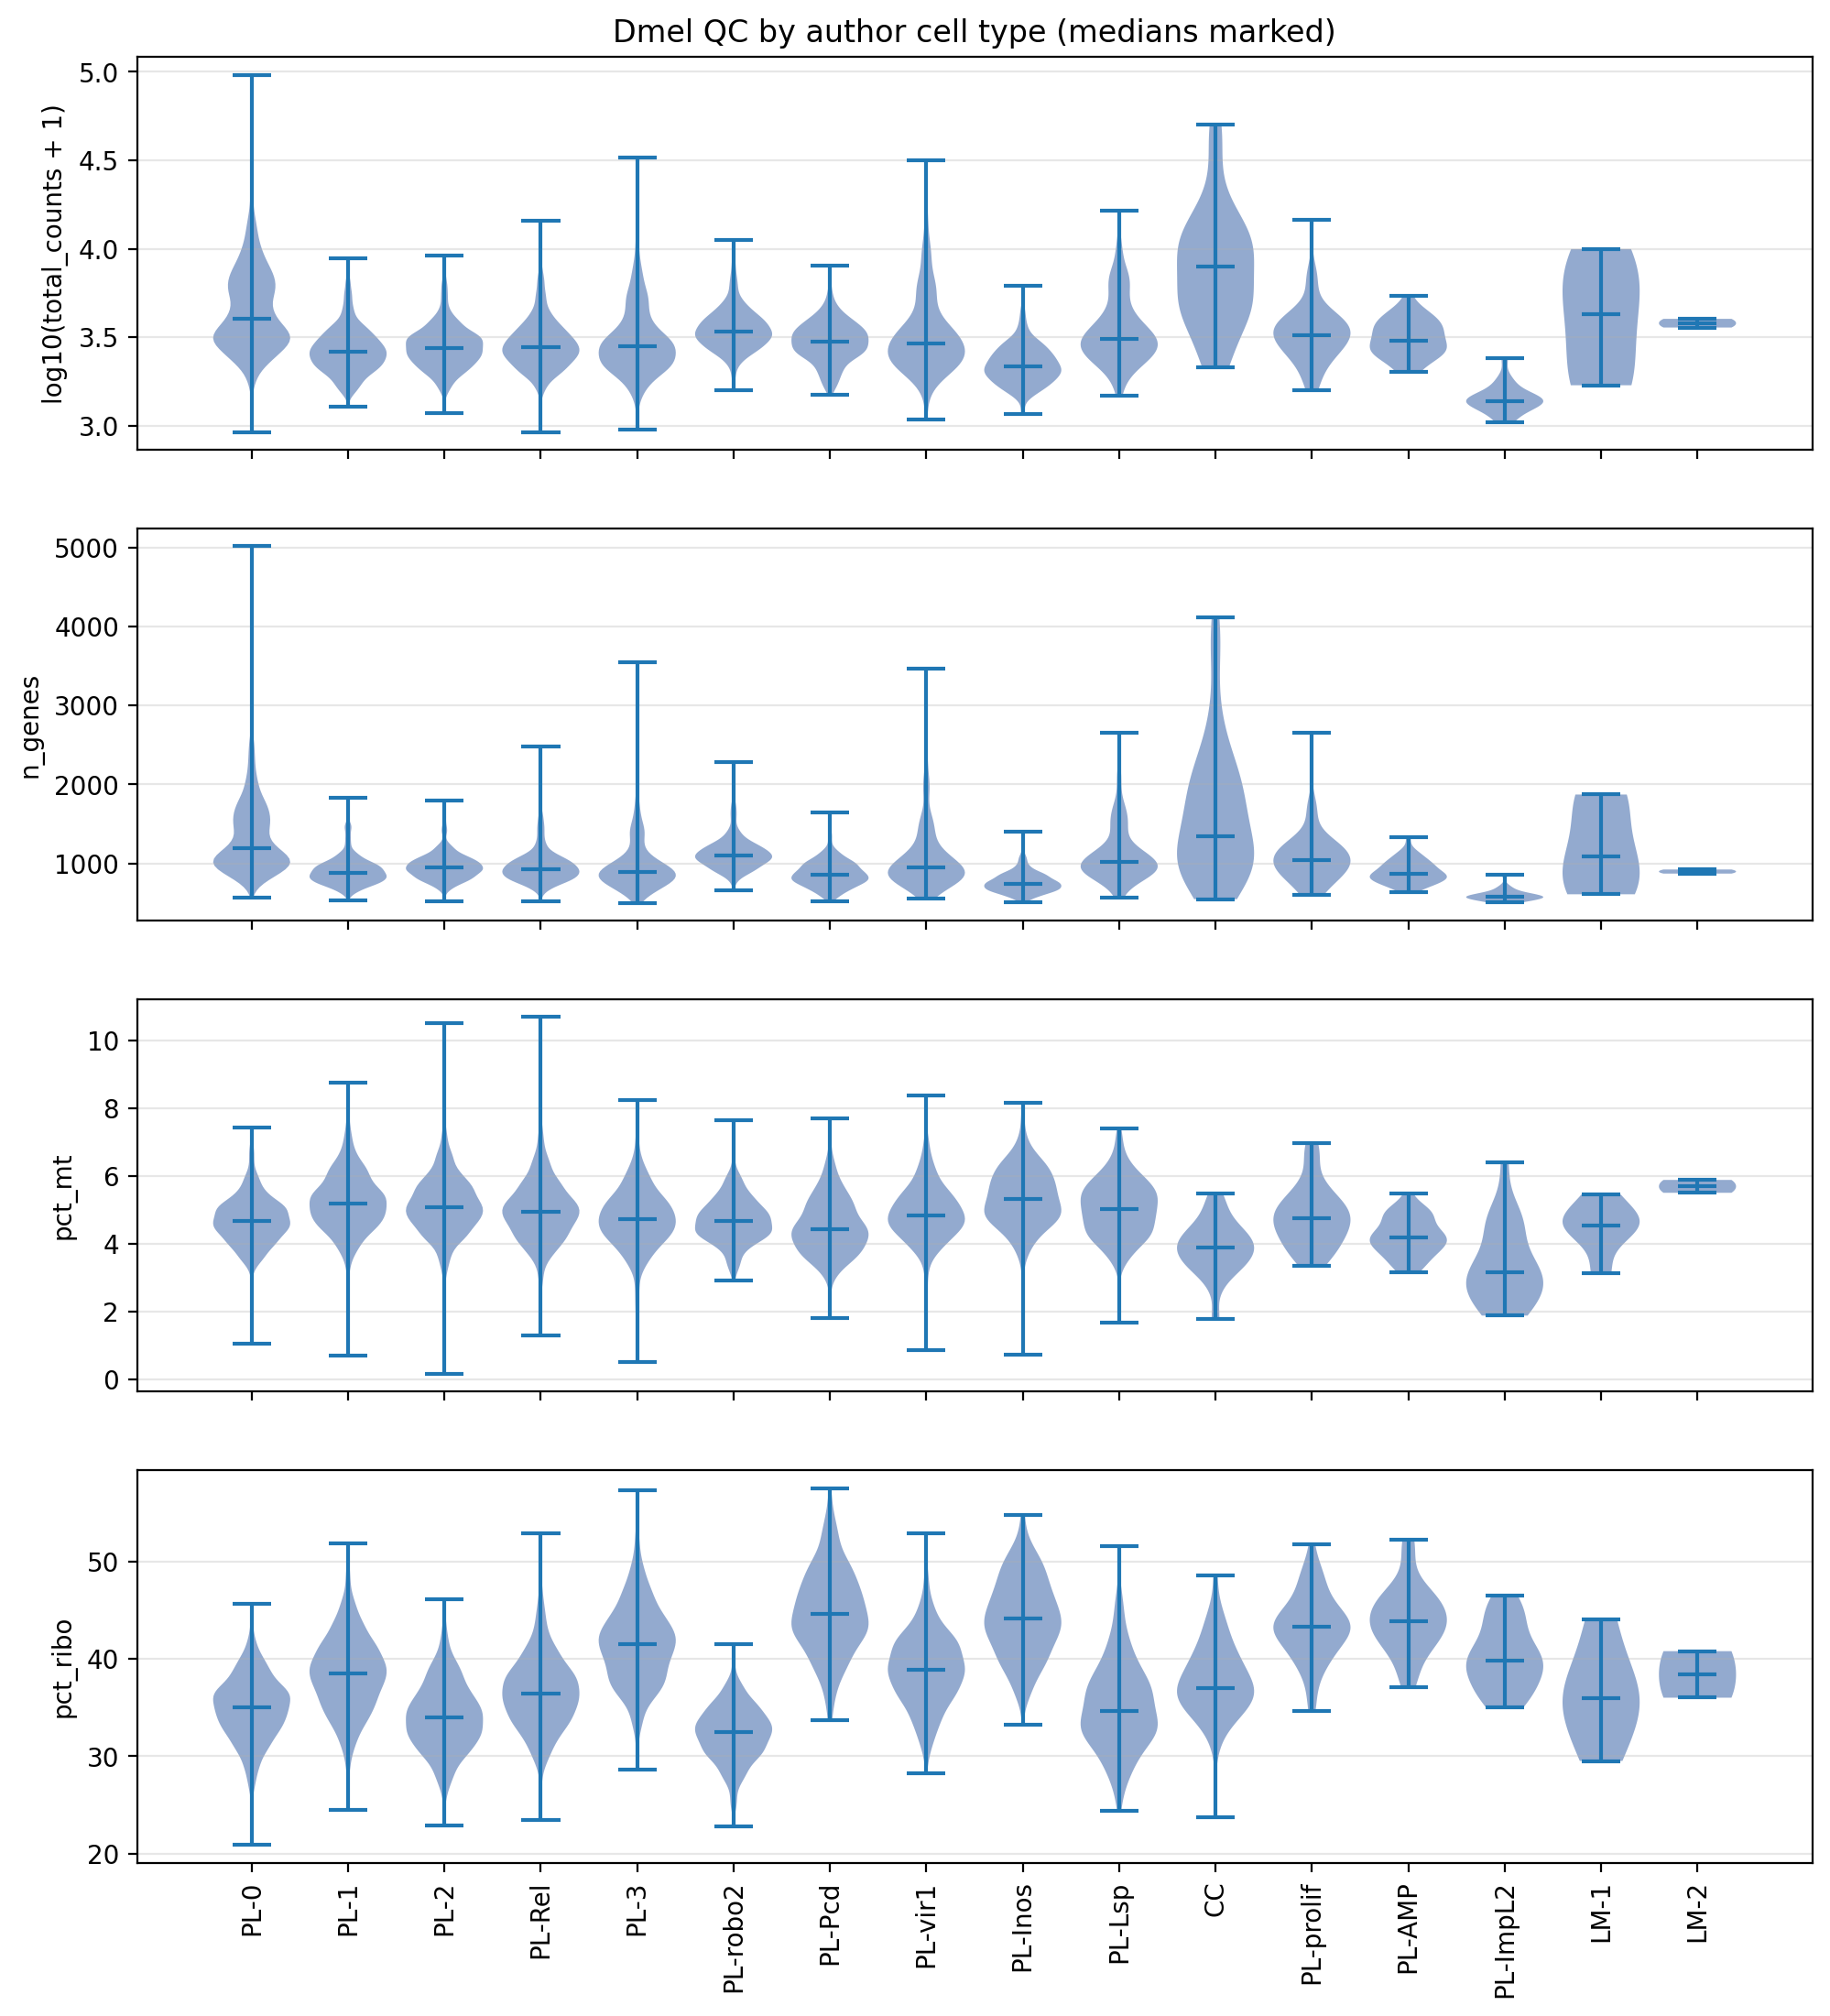
- Quality is tight: mito reads are about 5% with no low-quality tail, as expected after the authors’ 500-gene cutoff. Ribosomal reads are about 37%, normal for fly.
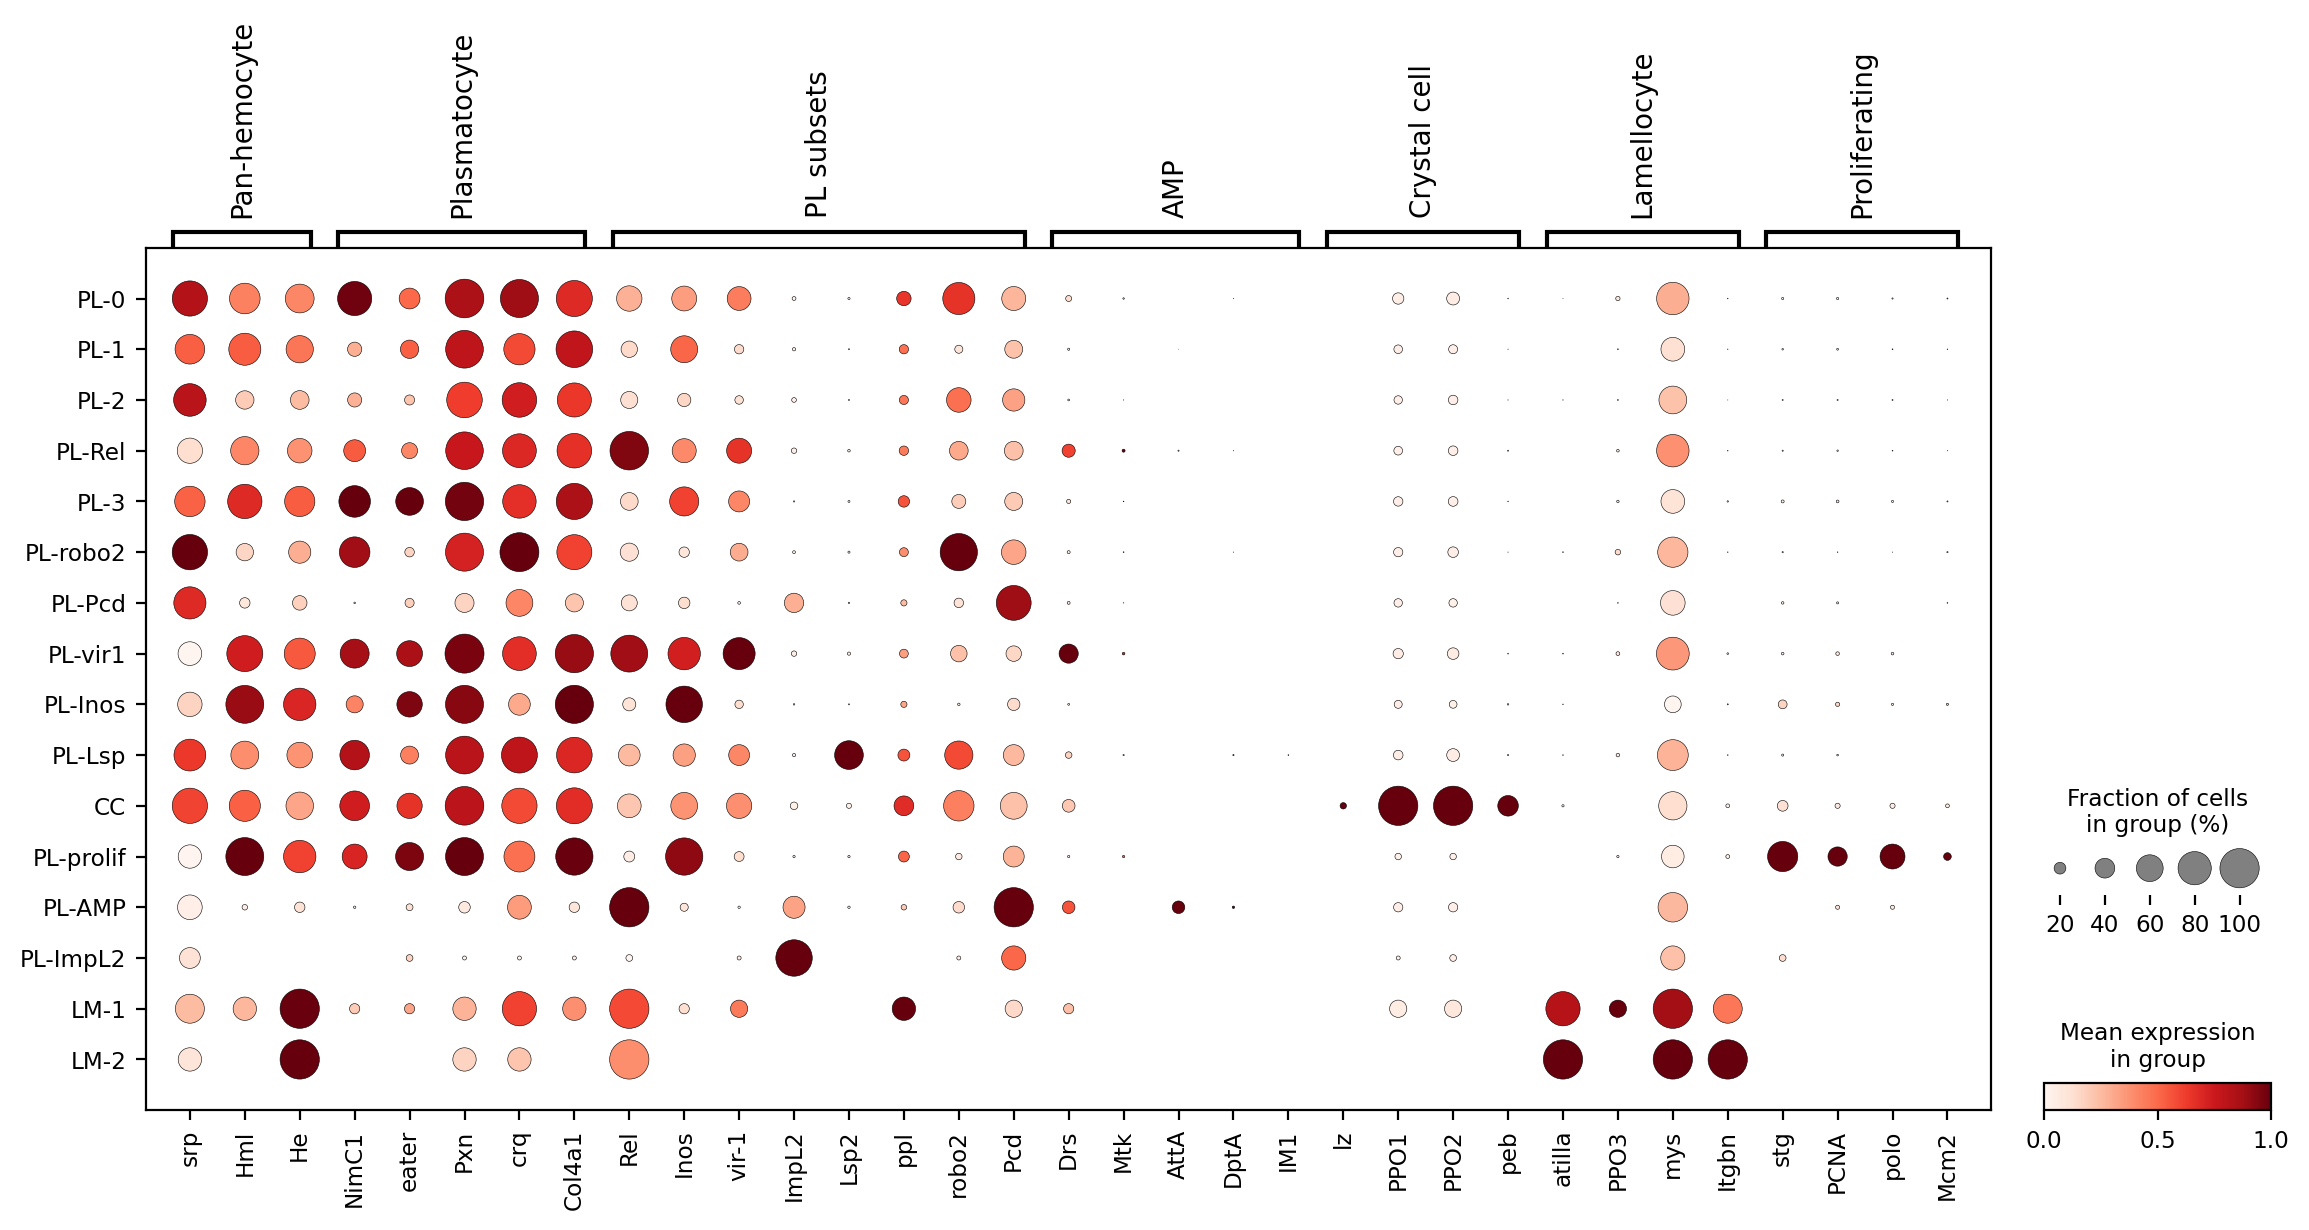
- Markers match the labels (Figure 3): crystal cells (CC) express PPO1, PPO2 and lz; lamellocytes atilla, Itgbn and mys; PL-prolif stg and polo; PL-Lsp Lsp2; PL-Rel Rel; PL-Inos Inos; plasmatocytes NimC1, eater, Pxn and crq.
- Flags reflect biology: 40% of crystal cells are flagged, but only because they carry more UMIs (median 7,887). They are kept.
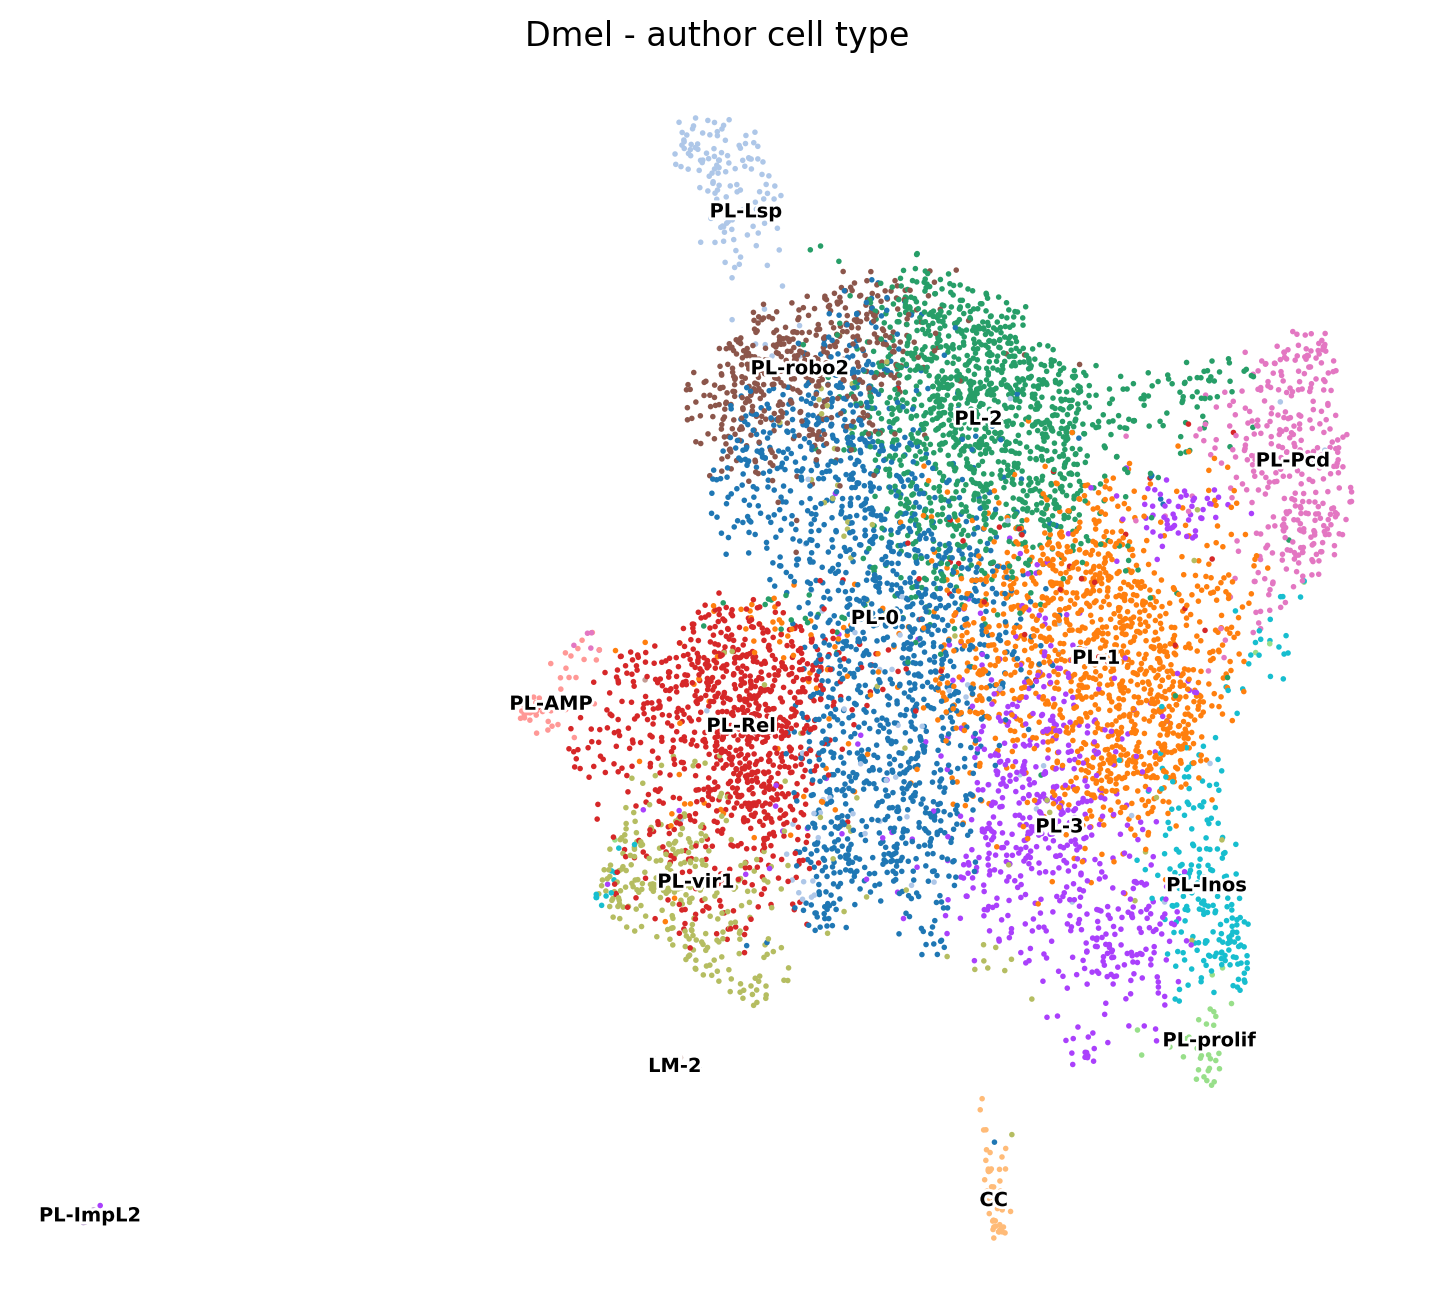
- Very small groups: lamellocytes are only 8 cells (LM-1 6, LM-2 2), as expected in uninfected larvae. PL-ImpL2 (21 cells) sits far from all other cells on the UMAP, has low depth (median 1,373 UMIs) and weak srp, Hml and NimC1; it may not be hemocytes and should be checked before it is treated as a plasmatocyte subtype.
- The main plasmatocyte groups grade into one another: PL-0, PL-1 and PL-2 form a continuum and are split across several Leiden clusters, consistent with the original paper.
Human
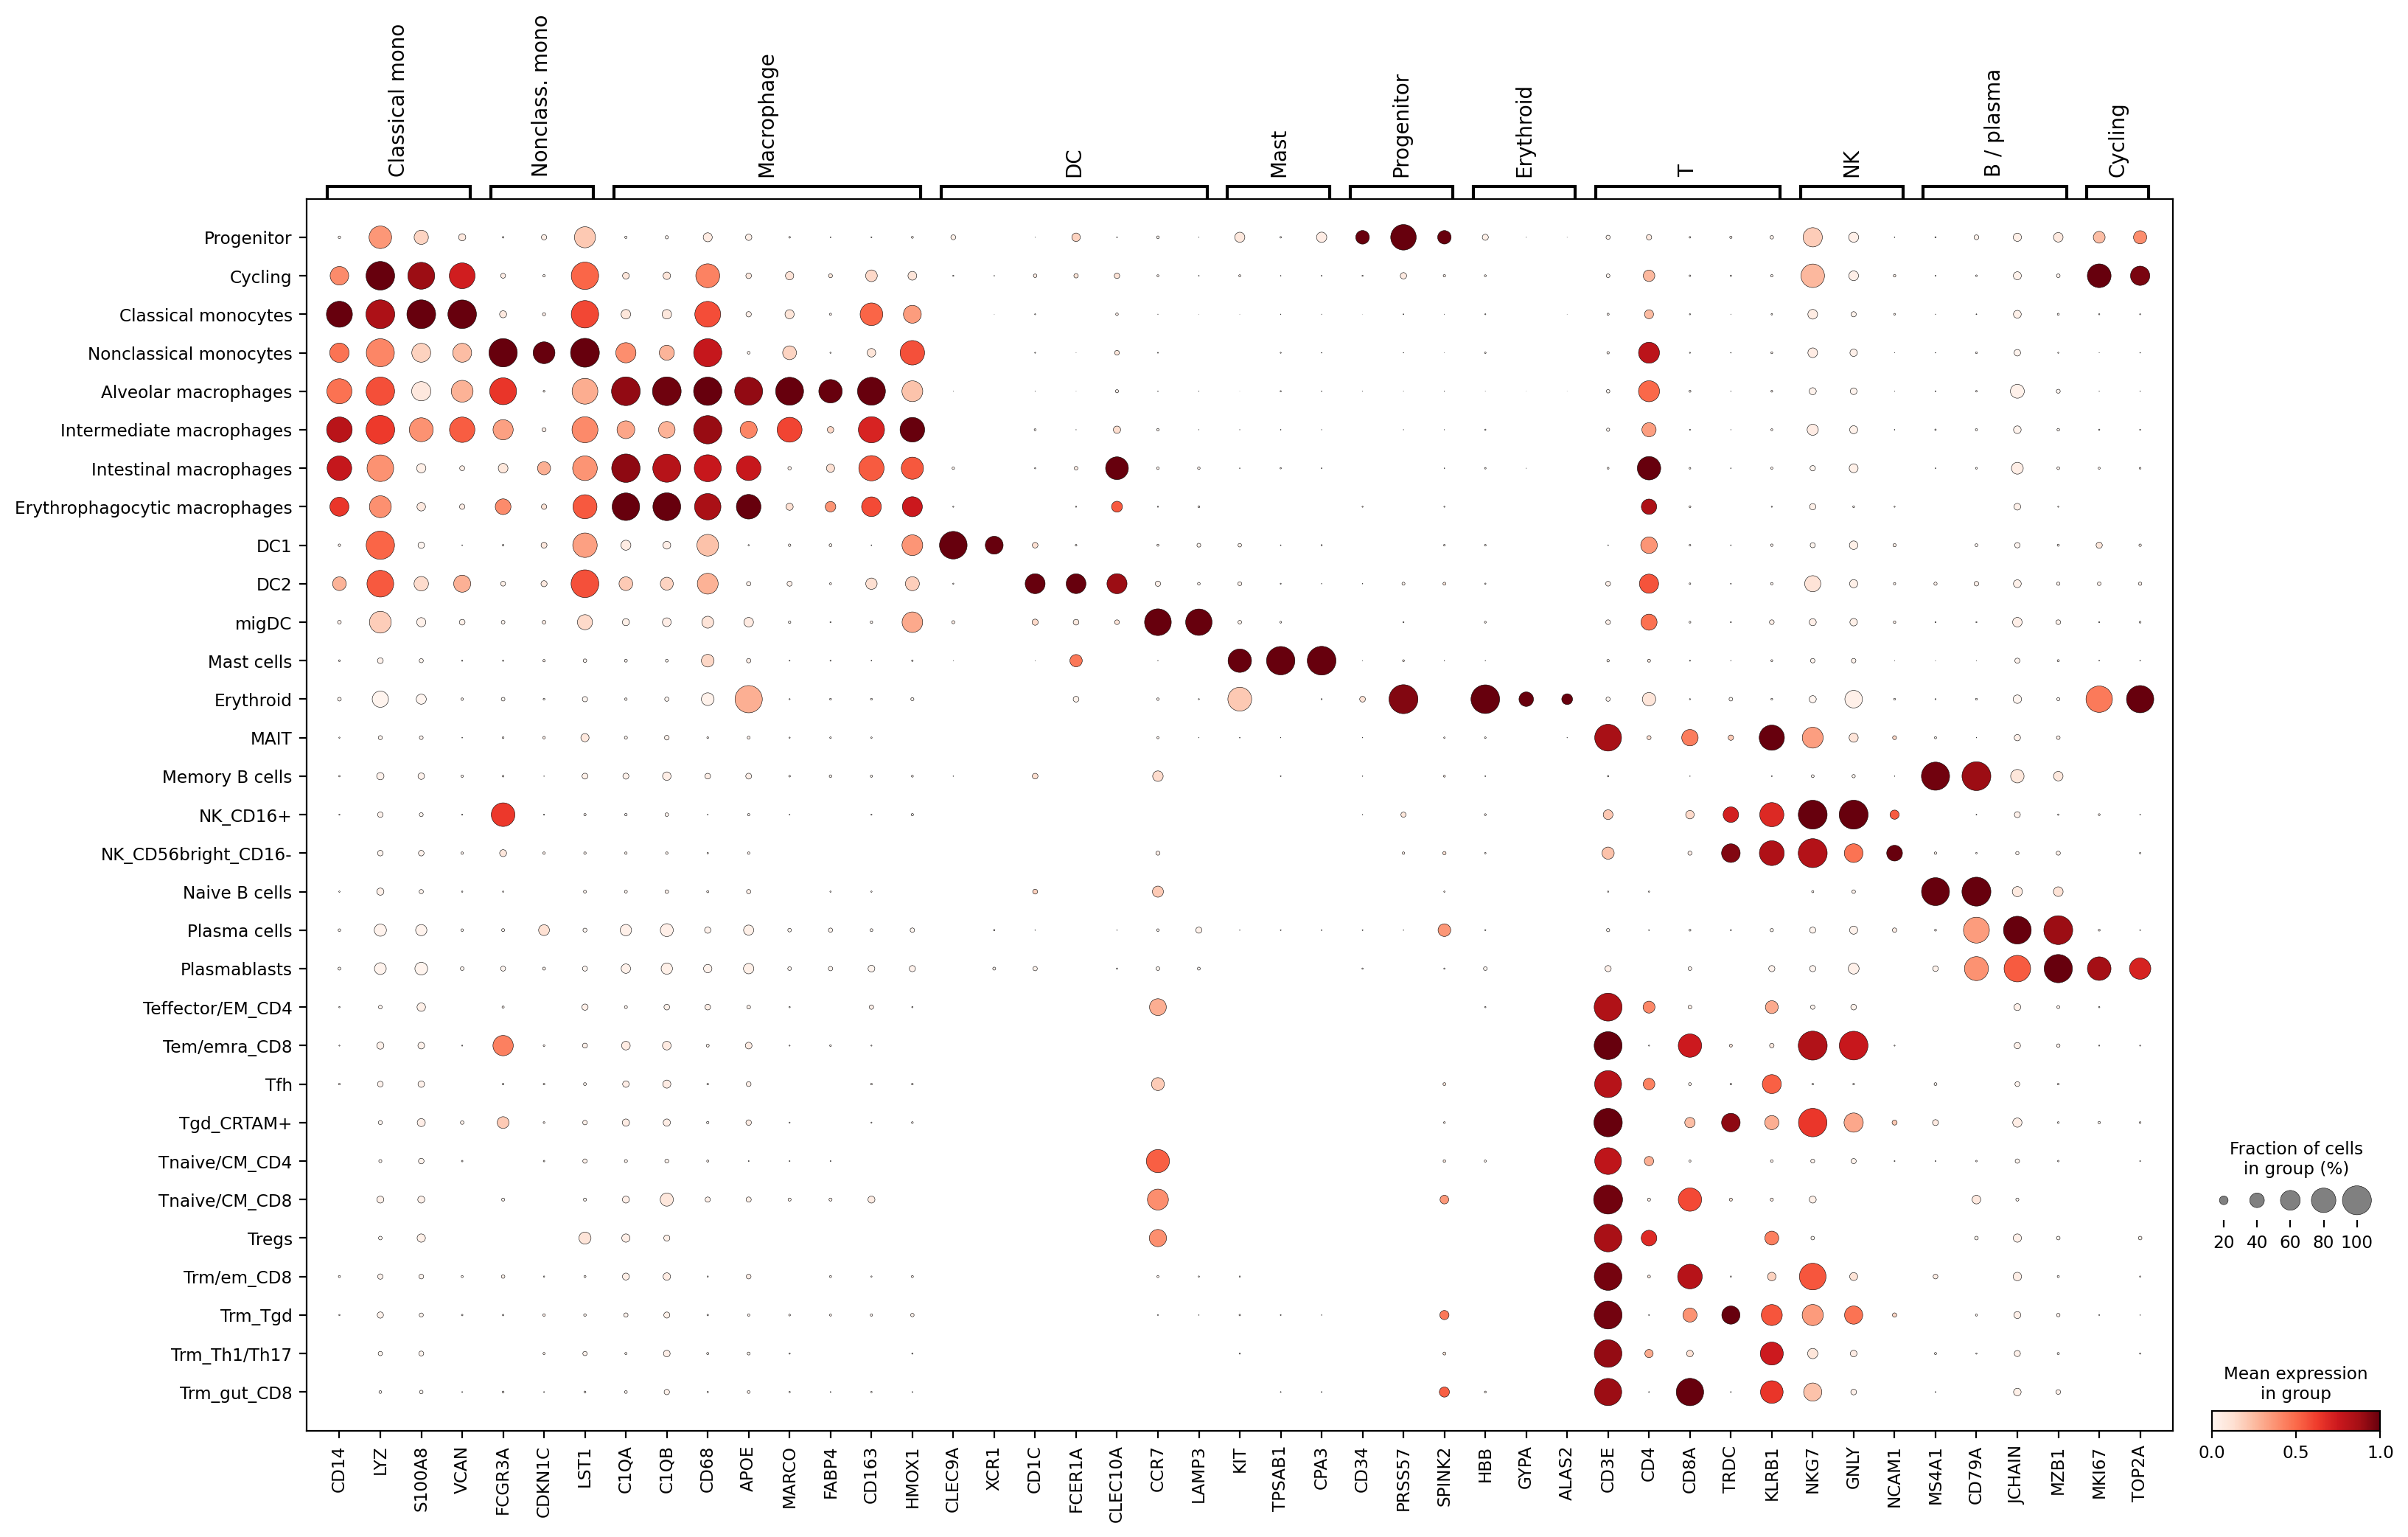
- Markers match the labels (Figure 6): CLEC9A/XCR1 in DC1, CD1C/FCER1A in DC2, CCR7/LAMP3 in migDC, MARCO/FABP4 in alveolar macrophages, KIT/TPSAB1/CPA3 in mast cells, CD34/PRSS57 in progenitors, and the expected T, NK and B cell markers.
- Mito flags follow tissue: all 962 flagged cells are above the 14.2% mito cutoff (none on depth), and intestinal macrophages have the highest share (22.7%), consistent with gut dissociation. The atlas was already filtered by its authors, so all cells are kept.
- Erythroid cells look like progenitors: the 78 erythroid cells express MKI67, TOP2A and PRSS57 and cluster with the progenitors (one Leiden cluster holds 202 progenitors and 78 erythroid cells), so they are erythroid progenitors rather than mature red cells. Keep this in mind if the zebrafish erythroid cells are mature.
- Donor and cell type are tied together: 96% of alveolar macrophages come from D496, while progenitors (94%), nonclassical monocytes (93%) and DCs come mostly from D503. This reflects which tissues each donor gave, so donor effects cannot be separated from cell type for these groups. Classical monocytes, sampled evenly across four tissues, are the only well-mixed group (Figure 7). No correction is planned, but it is listed in the caveats.

Open decisions
- Human label granularity. SATURN uses each species’ labels to guide training. Human now has 31 fine labels, against 16 for fly and 9 for zebrafish. Options: keep them; collapse the 18 lymphocyte subtypes to the 7 groups in
sample_group(CD4 T, CD8 T, γδ T, MAIT, NK, B, plasma); or use Leiden clusters, as for the other species. - Human depth. Downsample human counts towards the depth of the other species, or leave them. This matters for a benchmark, but it would be a new step and needs agreeing first.
- Small fly groups. Keep LM-1/LM-2 (perhaps merged as “LM”) and PL-ImpL2 as they are, or merge or drop them.
Outputs: /scratch/dark_genes/SATURN_Mnemi/07_new_species_QC/20261016_Dmel_Hsap_QC/ on Pegasus (summary.txt, per-cell-type QC tables, per-cell UMAP + QC CSVs, figures), synced locally to output/SATURN/20261016_Dmel_Hsap_QC/ without the h5ad files.
6. Troubleshooting on Pegasus
- Batch jobs don’t read
~/.bashrc.source ~/.bashrc; conda activatemade the inspection job exit in 0.1 s with empty logs. Fix:source ~/anaconda3/bin/activatethenconda activate saturn_protein, wrapped inset +u/set -u(conda’s scripts reference unset variables).02_embed.shnow has the same wrapper. grep -q+pipefail.conda env list | grep -q saturn_proteincan return false even when the env exists (grep closes the pipe early). Test for the env folder instead.- Bigmem affinity error.
-n 4 -R "rusage[mem=96000]"pended with “not enough processor units to satisfy the job affinity request”. Memory appears to be charged per core (4 × 96 GB). Fix: request total memory ÷ cores and addspan[hosts=1]; light jobs go tonormal. - Empty
.outfiles. With#BSUB -N, the LSF job summary (exit code, reason) is emailed instead of written to the.outfile; usebjobs -a -l <id>orbhist -l <id>. - Ensembl blocks recursive
wget.ftp.ensembl.org/robots.txtisDisallow: /, sowget -r -A <pattern>downloads only the directory listing and exits “successfully”. Fix: explicit file URLs, and a check that each FASTA is non-empty. (The older07aused the recursive pattern too.)
Caveats
- Human = 2 donors, about 52% / 48% of cells; donor and tissue effects cannot be separated from each other within human. The QC update shows donor is also tied to cell type: alveolar macrophages are 96% D496, progenitors and nonclassical monocytes ~93% D503.
- Human depth: median 9,604 UMIs per cell, against 1,947–6,138 for the other five species (Table 5).
- Fly = one library, one strain (OregonR, pooled females). The Yoon et al. 2023 w1118 10x data (GEO GSE184781, ~2.2k cells, with labels) is a possible robustness check.
- No human neutrophils; mast cells are the only granulocyte-like human cells, and a mapping to them should be read as “granular secretory cell”, not “eosinophil”.
- Considered, not used: a dedicated human bone marrow dataset (HCA immune census, 8 donors), which would better match the zebrafish input (kidney marrow cell types: HPC, myeloid progenitors, erythroid, neutrophils, eosinophils). Not used because it is older 10x chemistry, the released matrices have no cell calling or expert labels, and 10x bone marrow data generally contain few or no neutrophils and eosinophils (low RNA content; density separation), so it would not fill the granulocyte gap. A sorted neutrophil dataset (Montaldo et al. 2022, 10x 3’ v3, FASTQ only) remains the option if granulocytes become important.
- Check the zebrafish source. Project notes cite Jiao et al. (GSE186158), but that study profiled spleen with 10x v2, whereas the zebrafish input has kidney-marrow cell types and non-10x,
_Dr_kidneybarcodes. - Progenitor and erythroid matches may reflect cell state (proliferation, ribosomal/translation programs) rather than homology; check the macrogenes driving any cluster they join before interpreting it.
- Methods wording: the methods draft says “the longest protein isoform per gene was embedded”, but
02_embed.shmaps genes to all isoforms (zebrafish, and now fly and human). Check the other species and correct the text.
Next steps
Scripts
All in pipelines/scripts/saturn_embedding_comparison/.
| Script | Where | What it does |
|---|---|---|
07b_download_Cattenoz_CellTypist.sh |
Pegasus (transfers) |
downloads Cattenoz NI matrices + labels and the CellTypist Myeloid / Global h5ads; md5 and HDF5 checks |
07c_inspect_Cattenoz_CellTypist.sh |
Pegasus | read-only diagnostic: QC, label matching, assay × donor × tissue tables, raw-count checks |
07d_prepare_Dmel_Hsap.sh |
Pegasus | builds Dmel_saturn.h5ad and Hsap_saturn.h5ad (filtering, subsampling, composition table); revised to add human progenitors and erythroid cells |
07f_QC_UMAP_Dmel_Hsap.sh |
Pegasus (bigmem) |
read-only QC of both SATURN inputs: per-cell-type QC tables, MAD outlier flags, per-species UMAPs, marker dot plots, six-species depth comparison (added 2026-10-16) |
07e_download_proteomes_Ens113.sh |
Pegasus (transfers) |
Ensembl 113 protein FASTAs + GTFs for human and fly |
run_config.sh |
Pegasus | adds Dmel and Hsap species blocks |
02_embed.sh |
Pegasus | adds the ensembl_gene_id mapping strategy and safe conda activation |
cd /scratch/dark_genes/SATURN_Mnemi
bsub < scripts/07b_download_Cattenoz_CellTypist.sh
bsub -q normal -n 1 -W 2:00 -R "rusage[mem=24000] span[hosts=1]" < scripts/07c_inspect_Cattenoz_CellTypist.sh
bsub < scripts/07d_prepare_Dmel_Hsap.sh
bsub < scripts/07e_download_proteomes_Ens113.sh
bsub < scripts/07f_QC_UMAP_Dmel_Hsap.sh   # 2026-10-16 update
SPECIES=Dmel bsub -q normal -n 8 -R "rusage[mem=4000] span[hosts=1]" < scripts/02_embed.sh
SPECIES=Hsap bsub -q normal -n 8 -R "rusage[mem=4000] span[hosts=1]" < scripts/02_embed.sh
References
- Cattenoz P.B. et al. (2020) Temporal specificity and heterogeneity of Drosophila immune cells. EMBO J 39:e104486. https://doi.org/10.15252/embj.2019104486
- Domínguez Conde C. et al. (2022) Cross-tissue immune cell analysis reveals tissue-specific features in humans. Science 376:eabl5197. https://doi.org/10.1126/science.abl5197
- Yoon S.-H., Cho B. et al. (2023) Molecular traces of Drosophila hemocytes reveal transcriptomic conservation with vertebrate myeloid cells. PLoS Genet 19:e1011077. https://doi.org/10.1371/journal.pgen.1011077
- Rives A. et al. (2021) Biological structure and function emerge from scaling unsupervised learning to 250 million protein sequences. PNAS 118:e2016239118.
- Rosen Y. et al. (2024) Toward universal cell embeddings: integrating single-cell RNA-seq datasets across species with SATURN. Nat Methods 21:1492–1500.
- Ensembl release 113 (Oct 2024). https://ftp.ensembl.org/pub/release-113/