Analysis·Project Mnemiopsis Phagocytes·Tools SATURN ESM-1b ESMC-600M (FANTASIA v4) eggNOG-mapper Python R
- ESM-1b groups orthologs across species about twice as well as the ESMC-600M embeddings we received (Table 3).
- The difference is already in the embeddings themselves, before SATURN runs (Table 4).
- Fixing ESMC’s vector lengths did not help. Other standard fixes improved ESMC but improved ESM-1b just as much, so the gap remained (Table 4).
- What changes: ESMC separates zebrafish genes from their invertebrate homologs (Table 5, Table 7).
- What stays the same: macrogene sharing among the three invertebrates, and deeply conserved gene families (Table 5, Table 8).
- What ESMC adds: its new cross-species links rarely share even a protein domain (12% vs 49% for links only ESM-1b makes); a small set group protein superfamilies (Table 10).
This entry follows the 2026-10-06 entry, which found that the ESMC vectors vary ~5-fold in length and that SATURN does not normalize them. Here: the length-normalized ESMC run, an ortholog benchmark across all runs, a test of standard embedding fixes, and what changes (and what doesn’t) in the macrogenes of each species.
Runs compared
All four runs use the same settings (3,000 macrogenes, 8,000 highly variable genes per species, seed 42) and are compared on the 31,702 genes present in all of them. Macrogene membership is fixed during SATURN’s pretraining, so the 4-species runs ran pretraining only (“macrogene-only”).
Results
1. ESM-1b recovers about twice as many orthologs
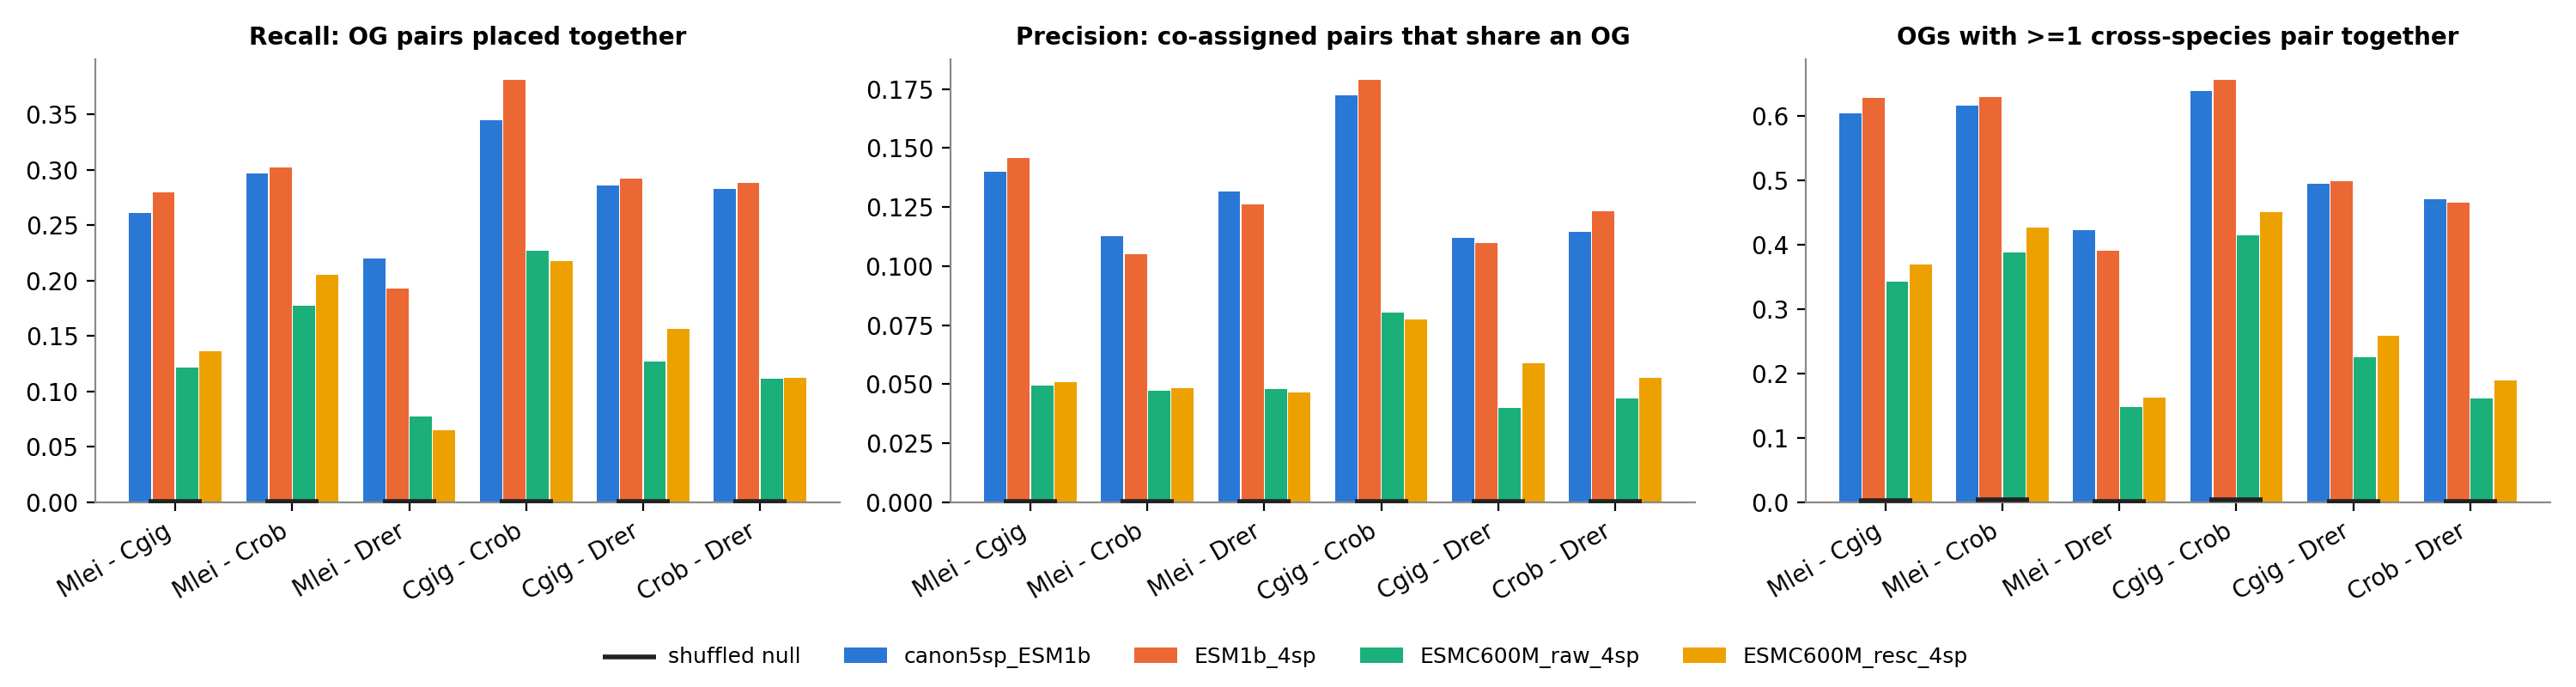
- Recall: ESM-1b puts 30% of true ortholog pairs in the same macrogene; ESMC 15–16%.
- Precision: of every 100 cross-species gene pairs that share a macrogene, about 13 are true orthologs with ESM-1b and about 6 with ESMC. The rest are unrelated or only distantly related genes.
- ESM-1b is about 2× better on both, for every species pair (Figure 1), including all Mnemiopsis pairs.
- Length-normalizing ESMC barely helps (recall 0.15 → 0.16): vector length was not the main problem.
- Dropping sea urchin did not hurt: ESM-1b 4sp matches the canonical run.
2. Is it SATURN, or the embeddings?
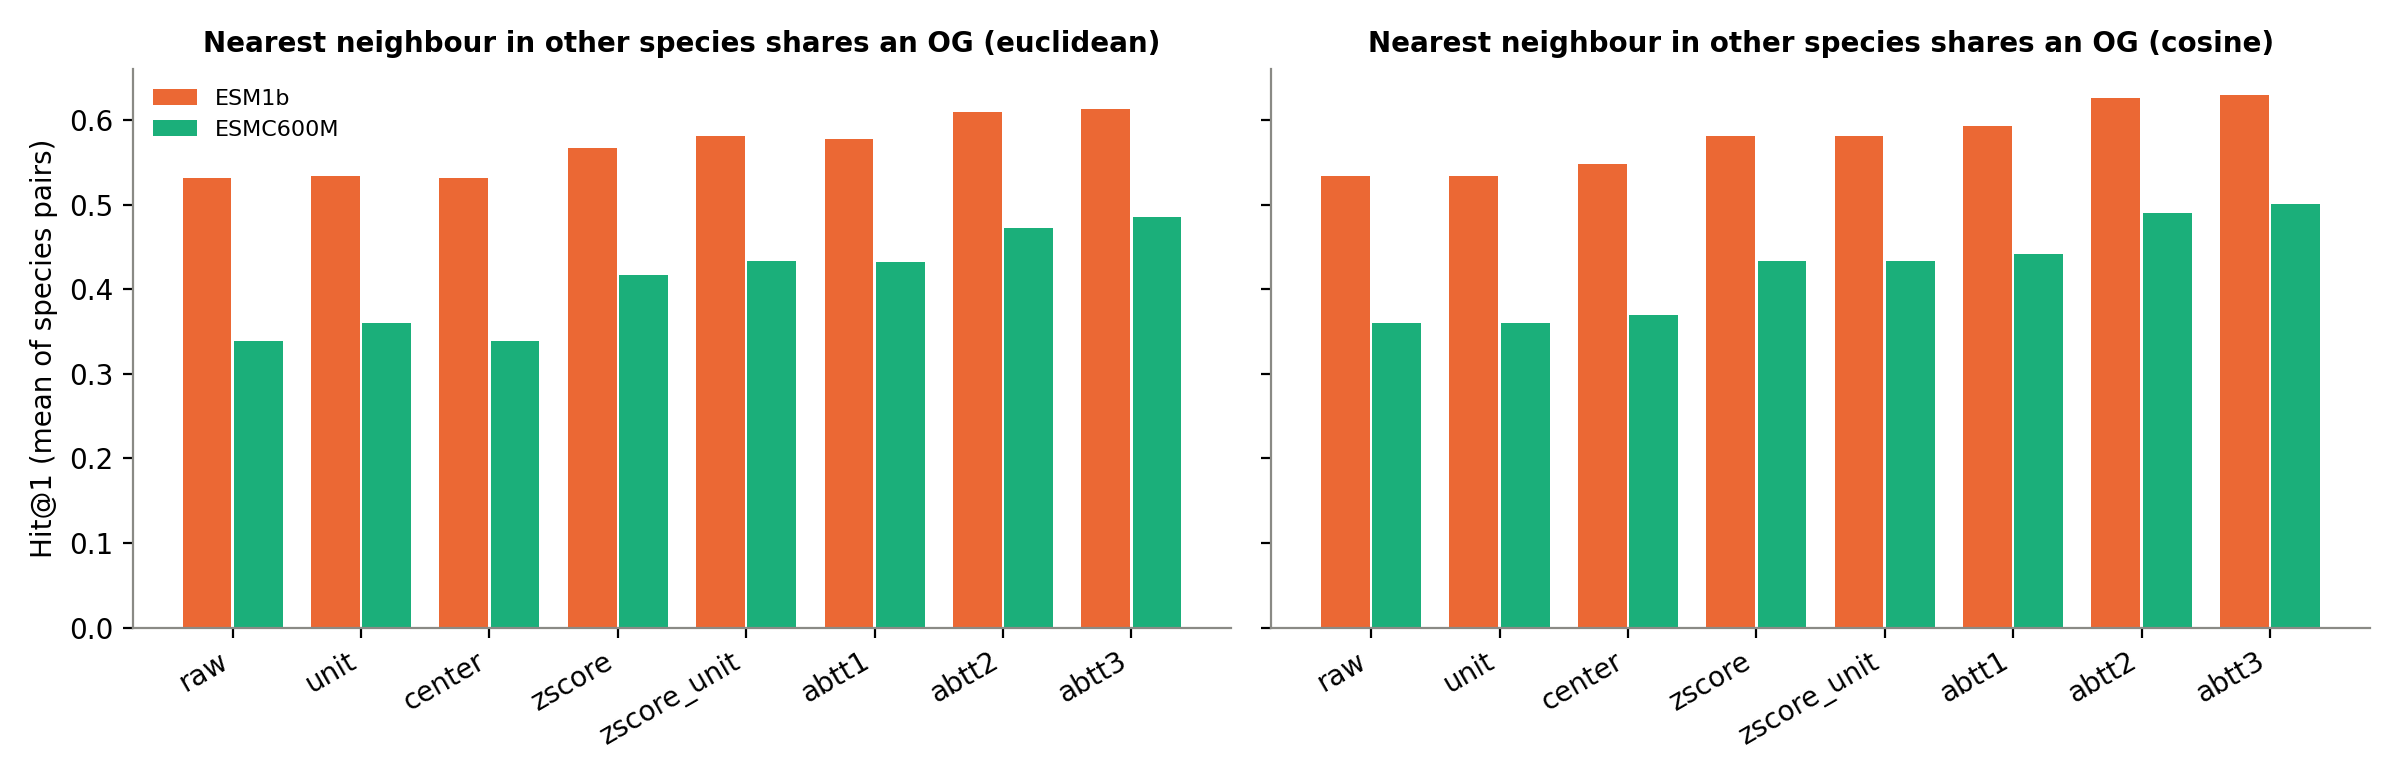
A fair objection is that ESMC might be fine and SATURN, or the vector-length problem, is what hurts it. We tested this directly on the embeddings, without running SATURN: for each gene, find the most similar gene in another species, and check whether it is a true ortholog (same OG). We then repeated the test after applying standard fixes for embeddings, to both models.
- ESM-1b is ahead before SATURN is involved, so the gap comes from the embeddings, not from SATURN.
- Fixing vector length changes almost nothing for ESMC (34% → 36%).
- The best fix helps ESMC (→ 49%) but helps ESM-1b equally (→ 61%), so ESMC never catches up. Its best version only reaches unprocessed ESM-1b.
3. How macrogene composition across species changes
Shared macrogenes between species pairs
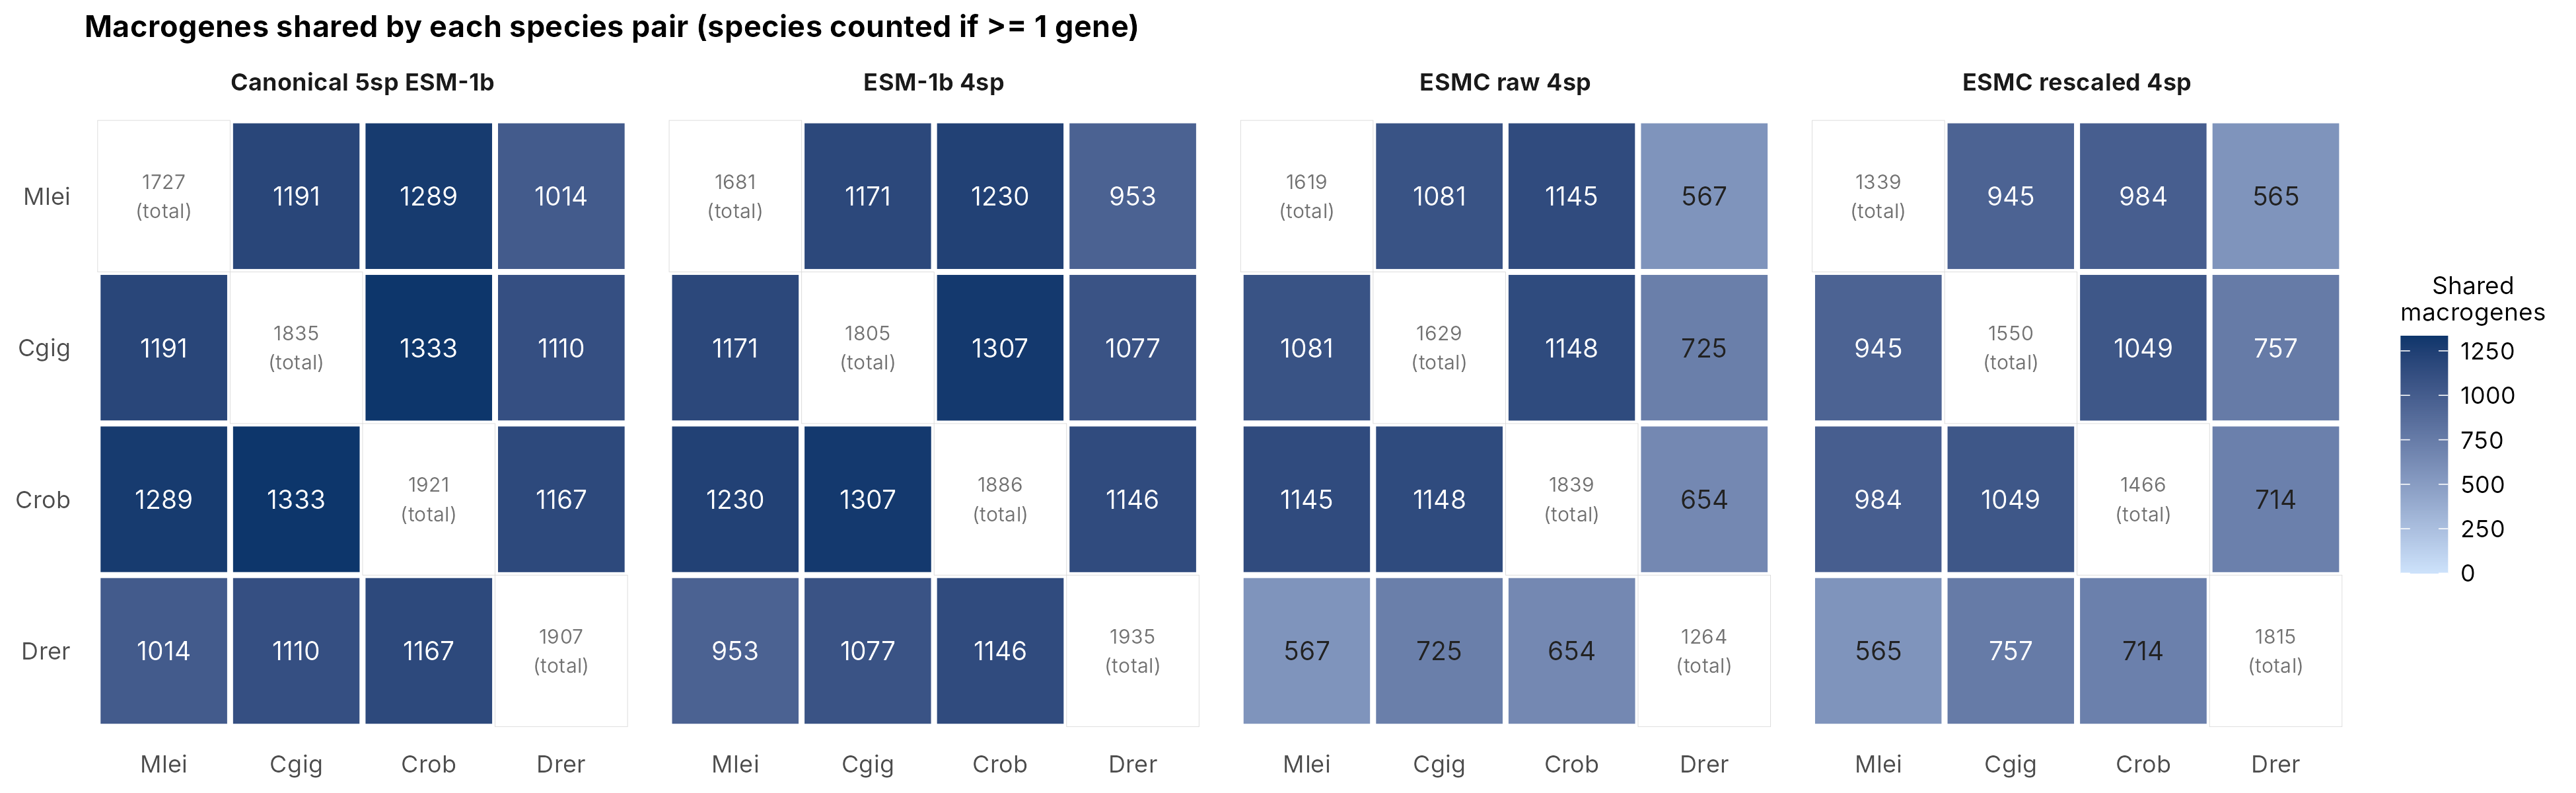
Raw counts depend on how many macrogenes each species occupies, so the fairer comparison is the Jaccard index: shared macrogenes ÷ macrogenes containing either species (1 = identical sets).
- Stays the same: sharing among the three invertebrates (Jaccard 0.49–0.55 in every run).
- Changes: every zebrafish pair drops by about a third with ESMC.
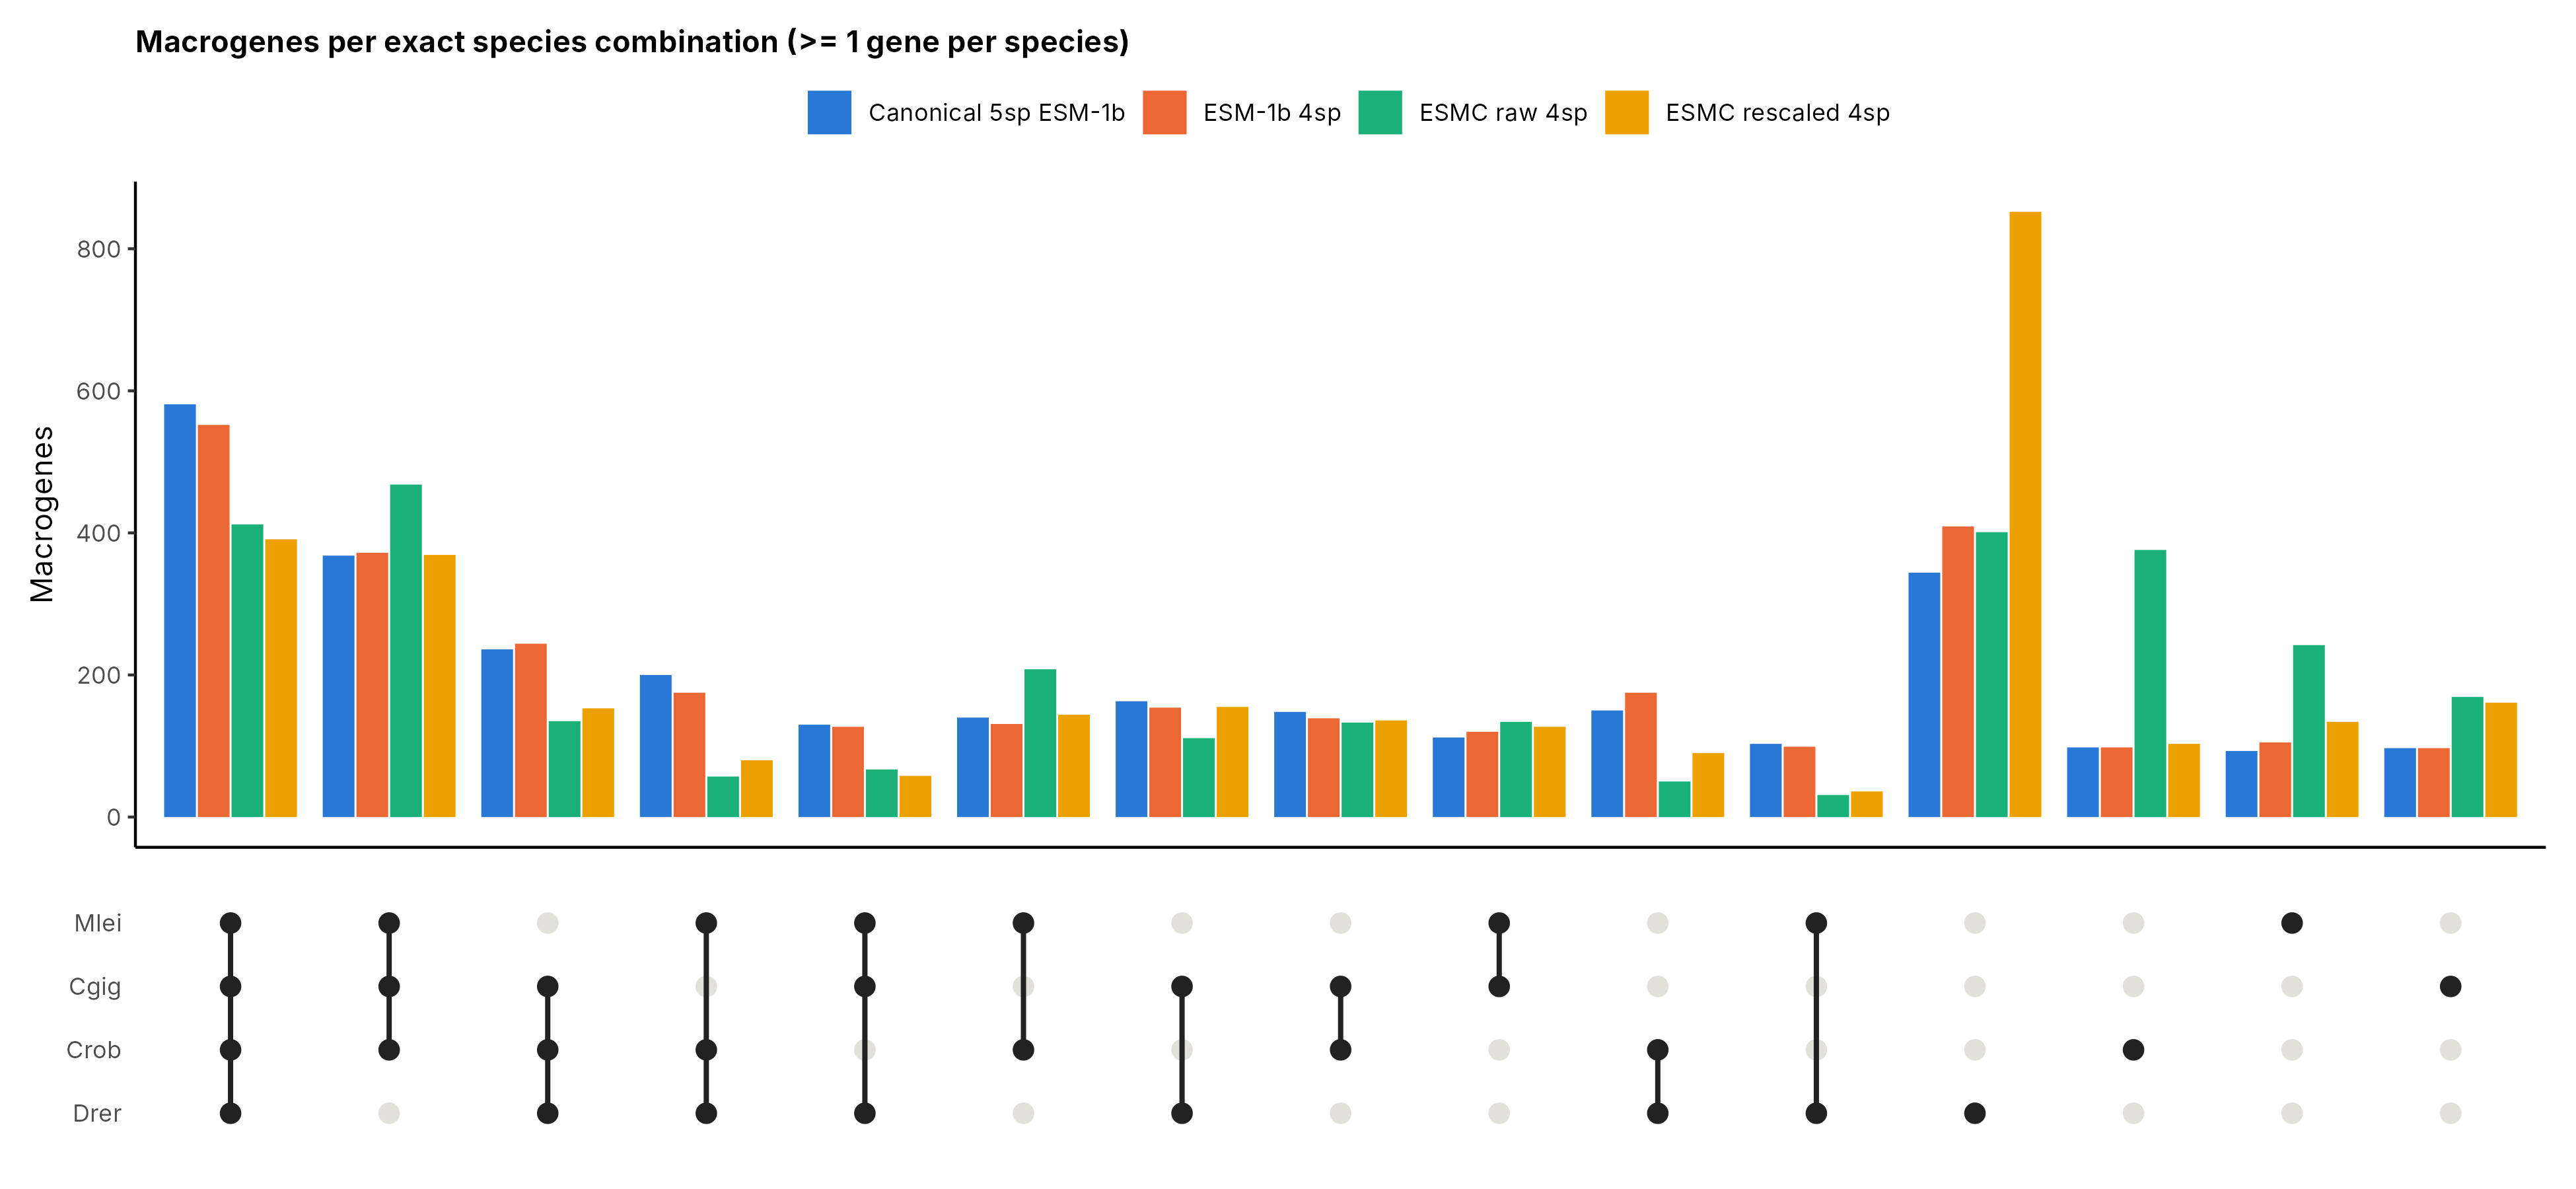
- Macrogenes containing all four species fall from 552 (ESM-1b) to 412 (raw) and 391 (rescaled) (Figure 4).
Single-species macrogenes
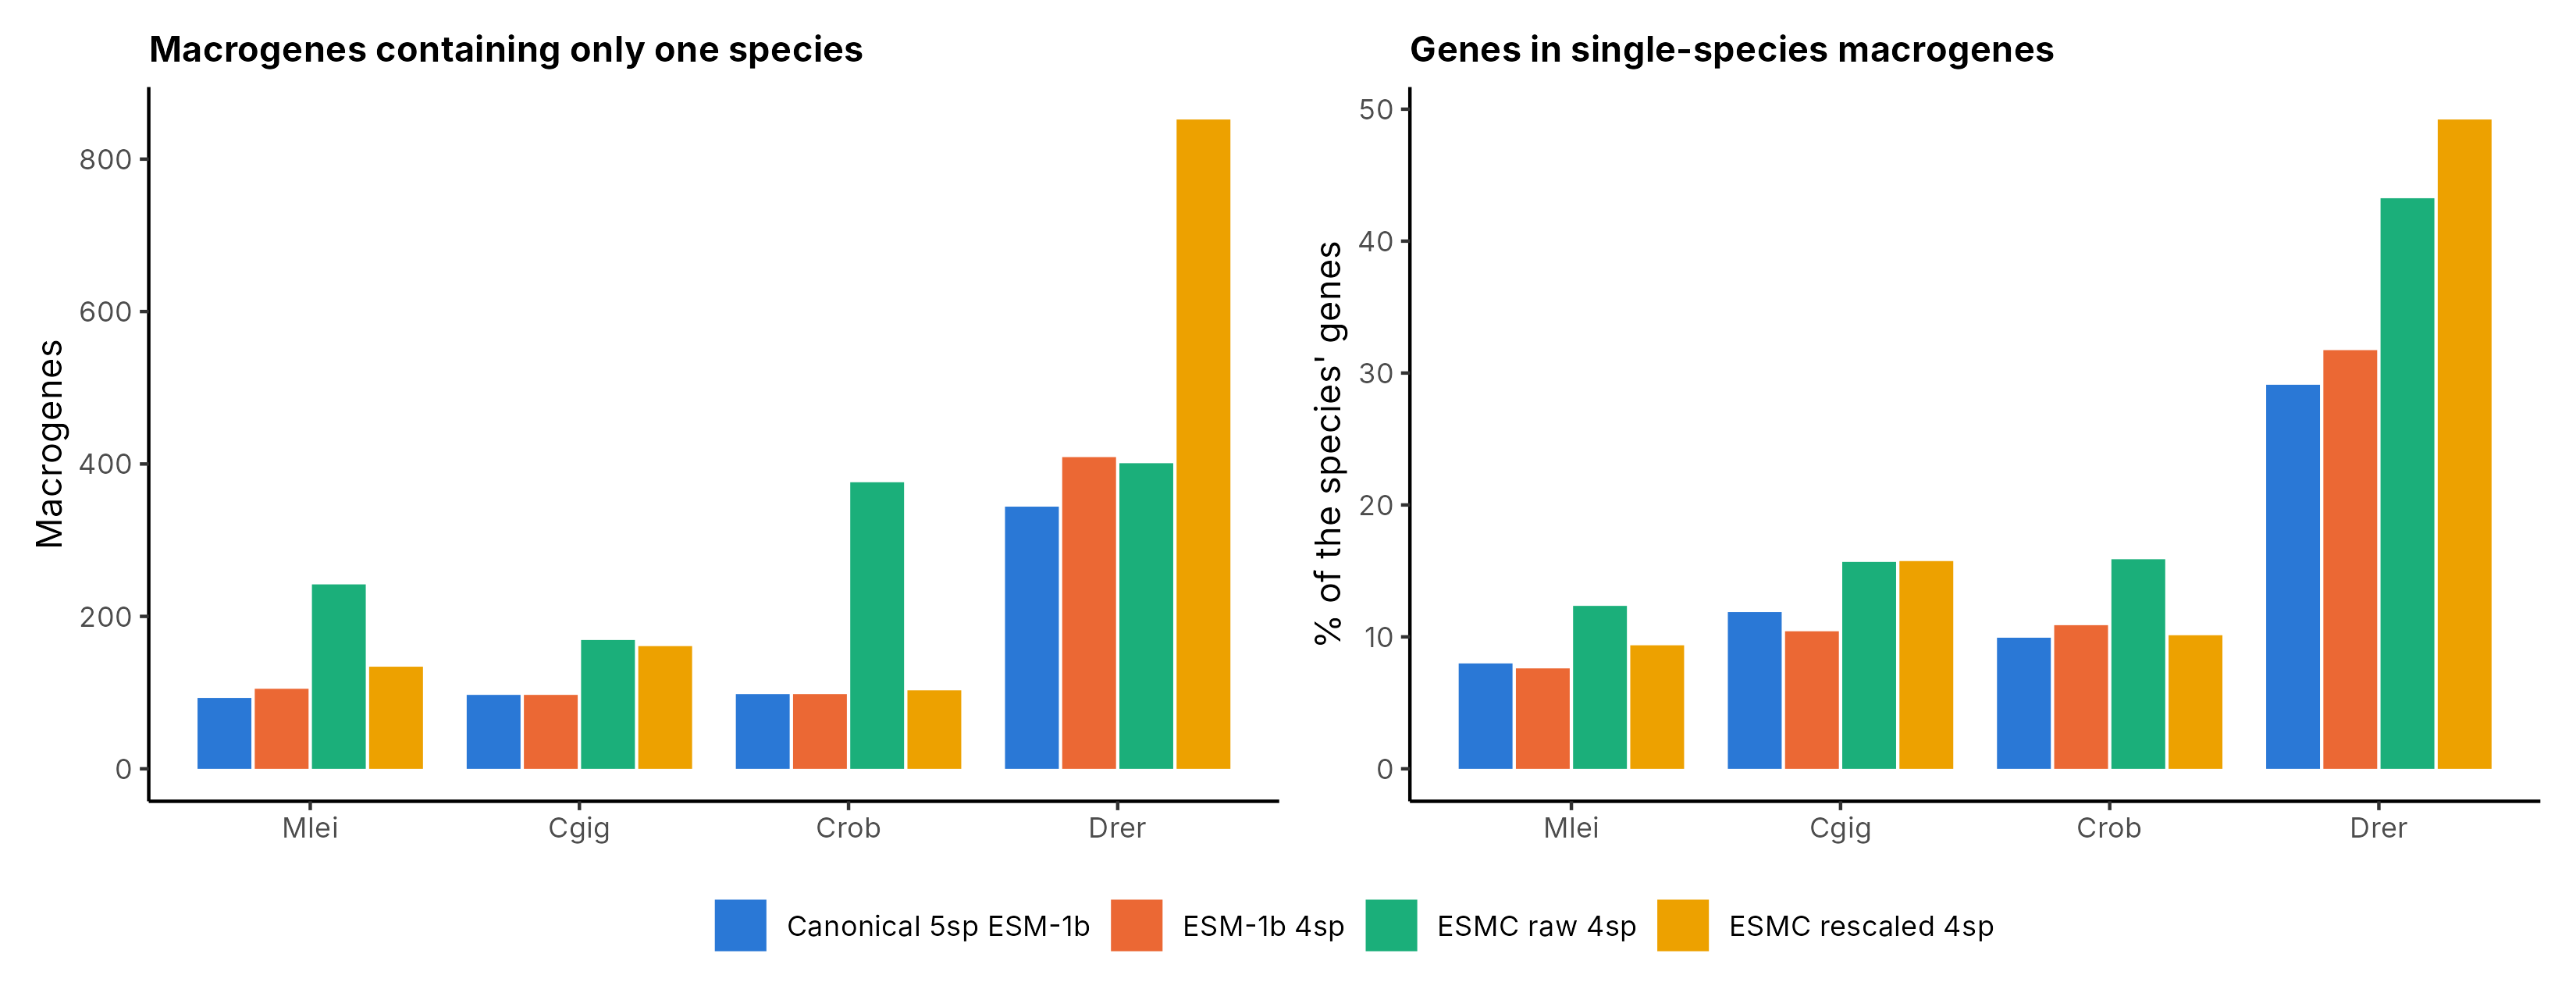
- With ESM-1b, each invertebrate has ~100 single-species macrogenes; zebrafish (the only vertebrate) has more, as expected.
- Raw ESMC inflates the invertebrate counts, many as one-gene macrogenes (a vector-length artifact; removed by rescaling).
- Rescaled ESMC returns the invertebrates to near ESM-1b levels but doubles zebrafish to 852: half of all zebrafish genes then sit in macrogenes with no other species (Figure 5).
4. Which genes keep or lose their cross-species partners
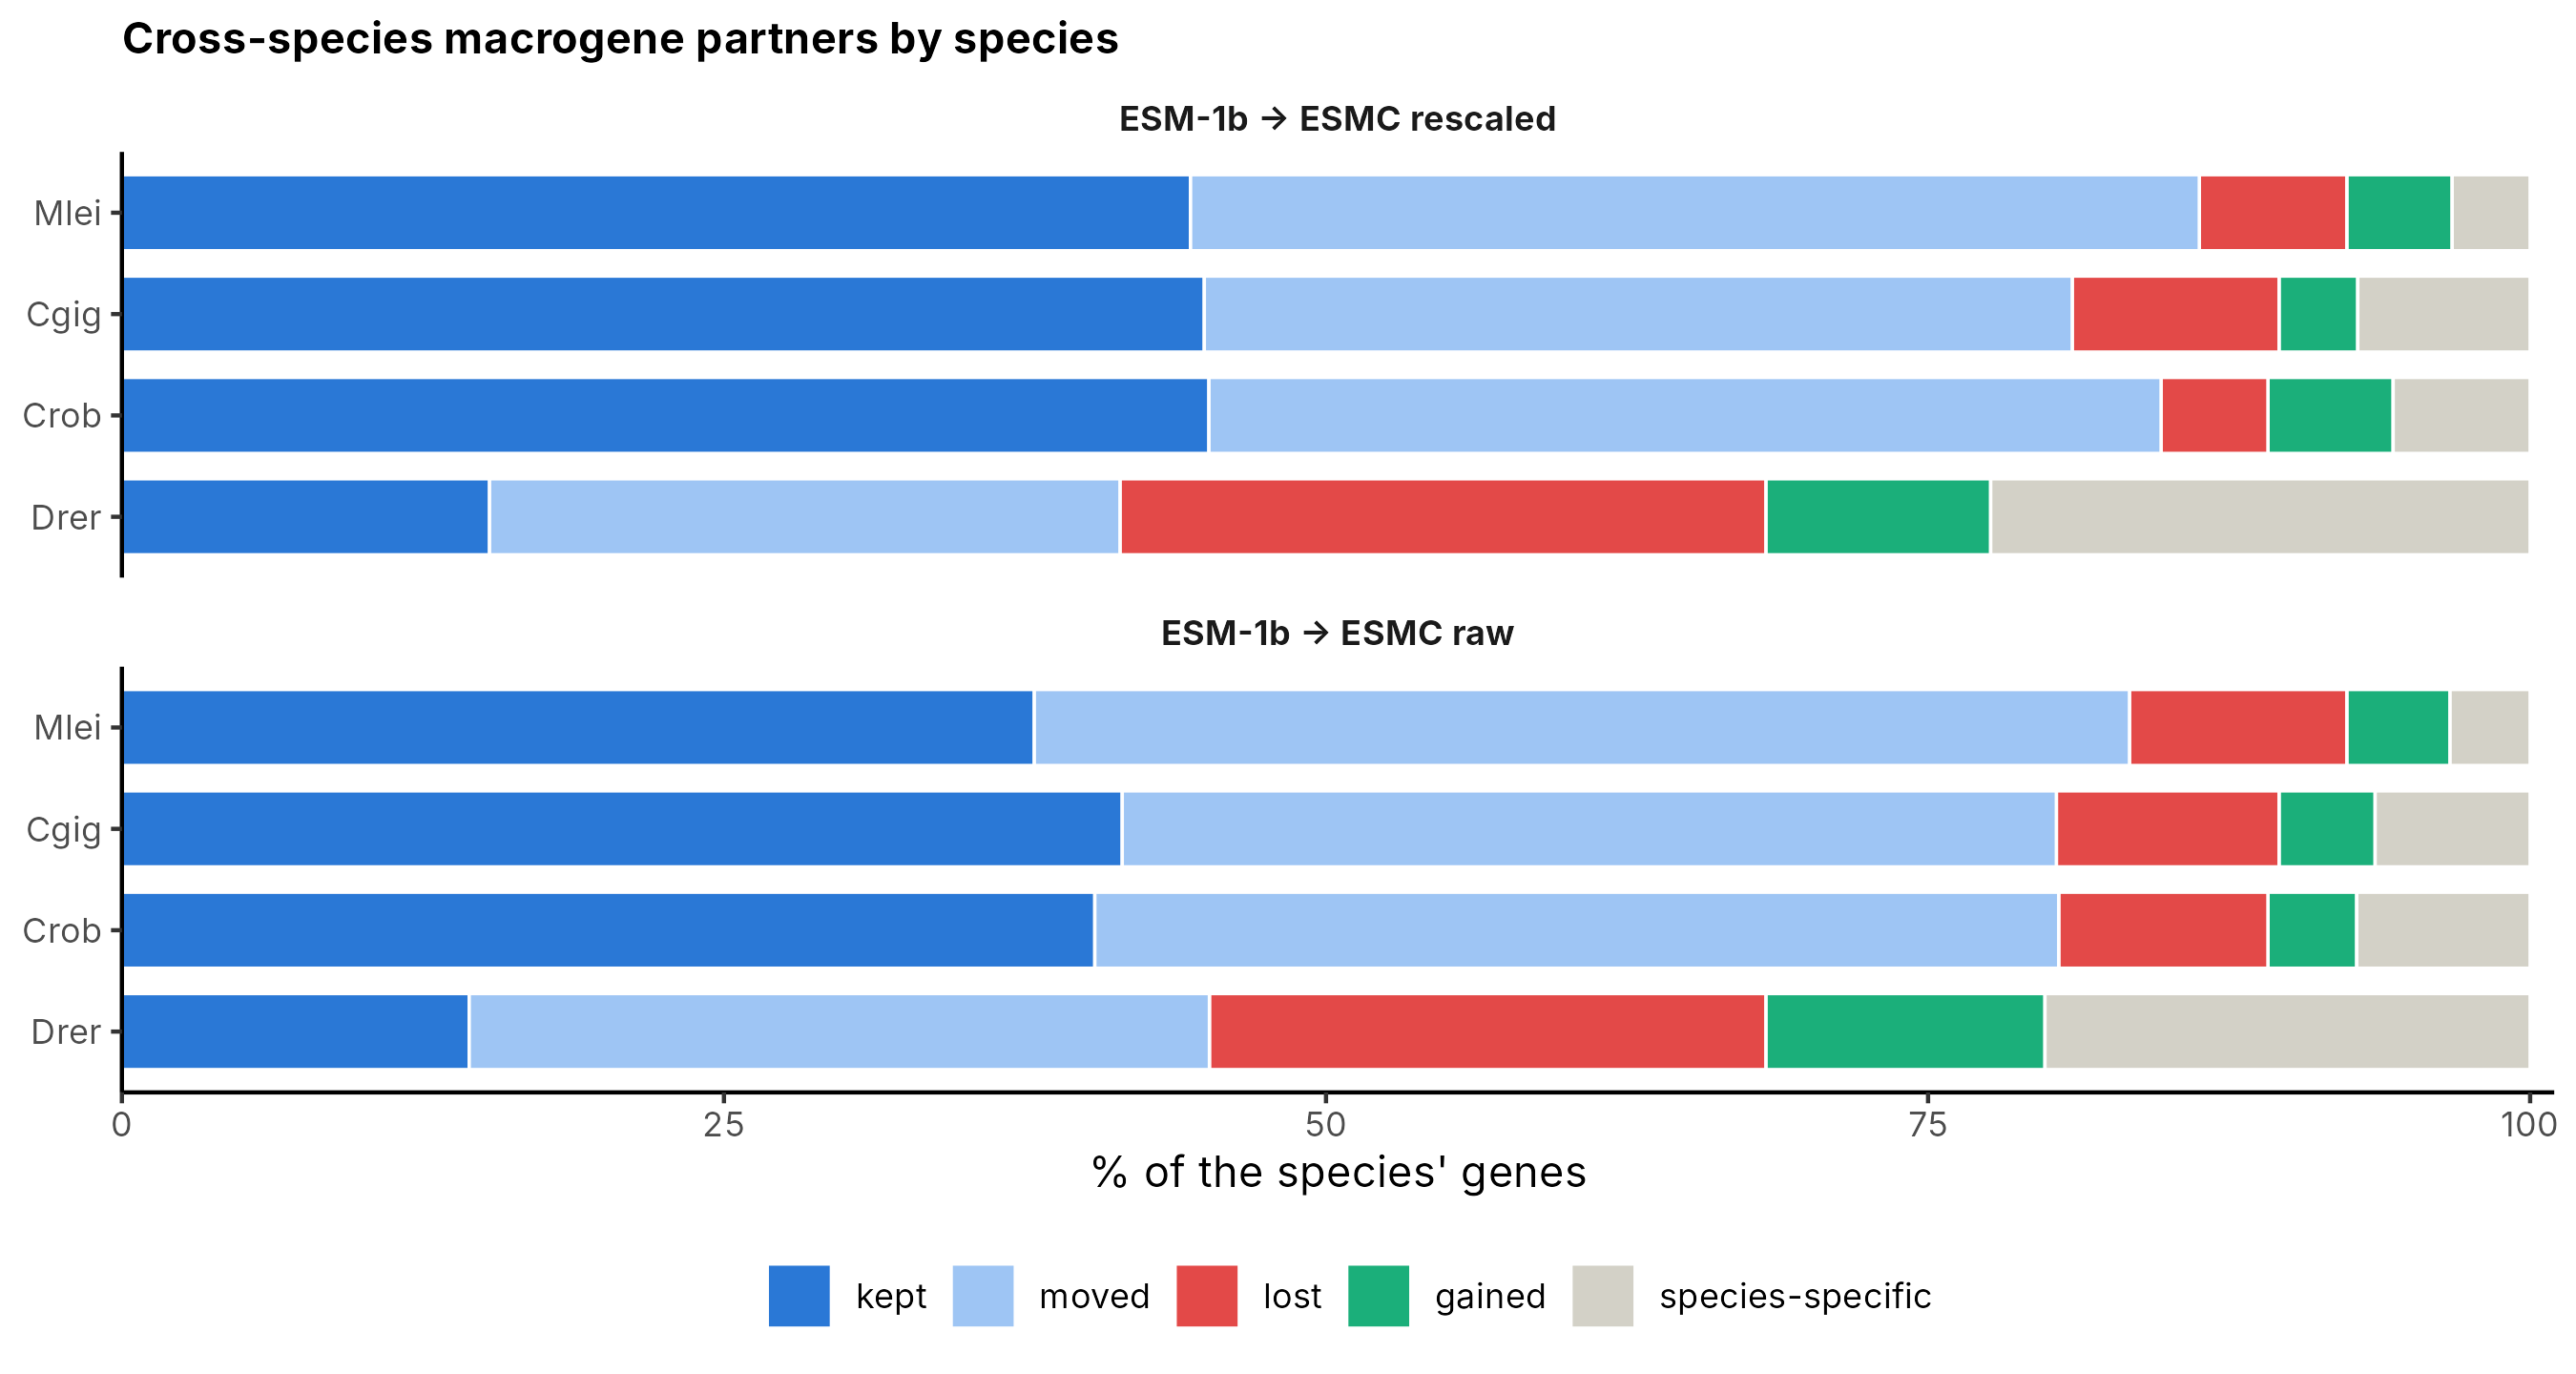
For each gene we compared its cross-species partners (genes from other species in the same macrogene) between ESM-1b 4sp and ESMC:
- kept: has cross-species partners in both runs, at least one the same
- moved: has cross-species partners in both runs, but different ones
- lost: has cross-species partners with ESM-1b, none with ESMC
- gained: none with ESM-1b, some with ESMC
- species-specific: no cross-species partners in either run
What stays the same
- Most invertebrate genes keep cross-species partners under either model (81–86% kept or moved).
- Kept links are the trustworthy ones. Zebrafish–invertebrate gene pairs found by both models share an eggNOG OG 39% of the time, vs 8.8% for pairs found only by ESM-1b and 1.3% for pairs found only by ESMC.
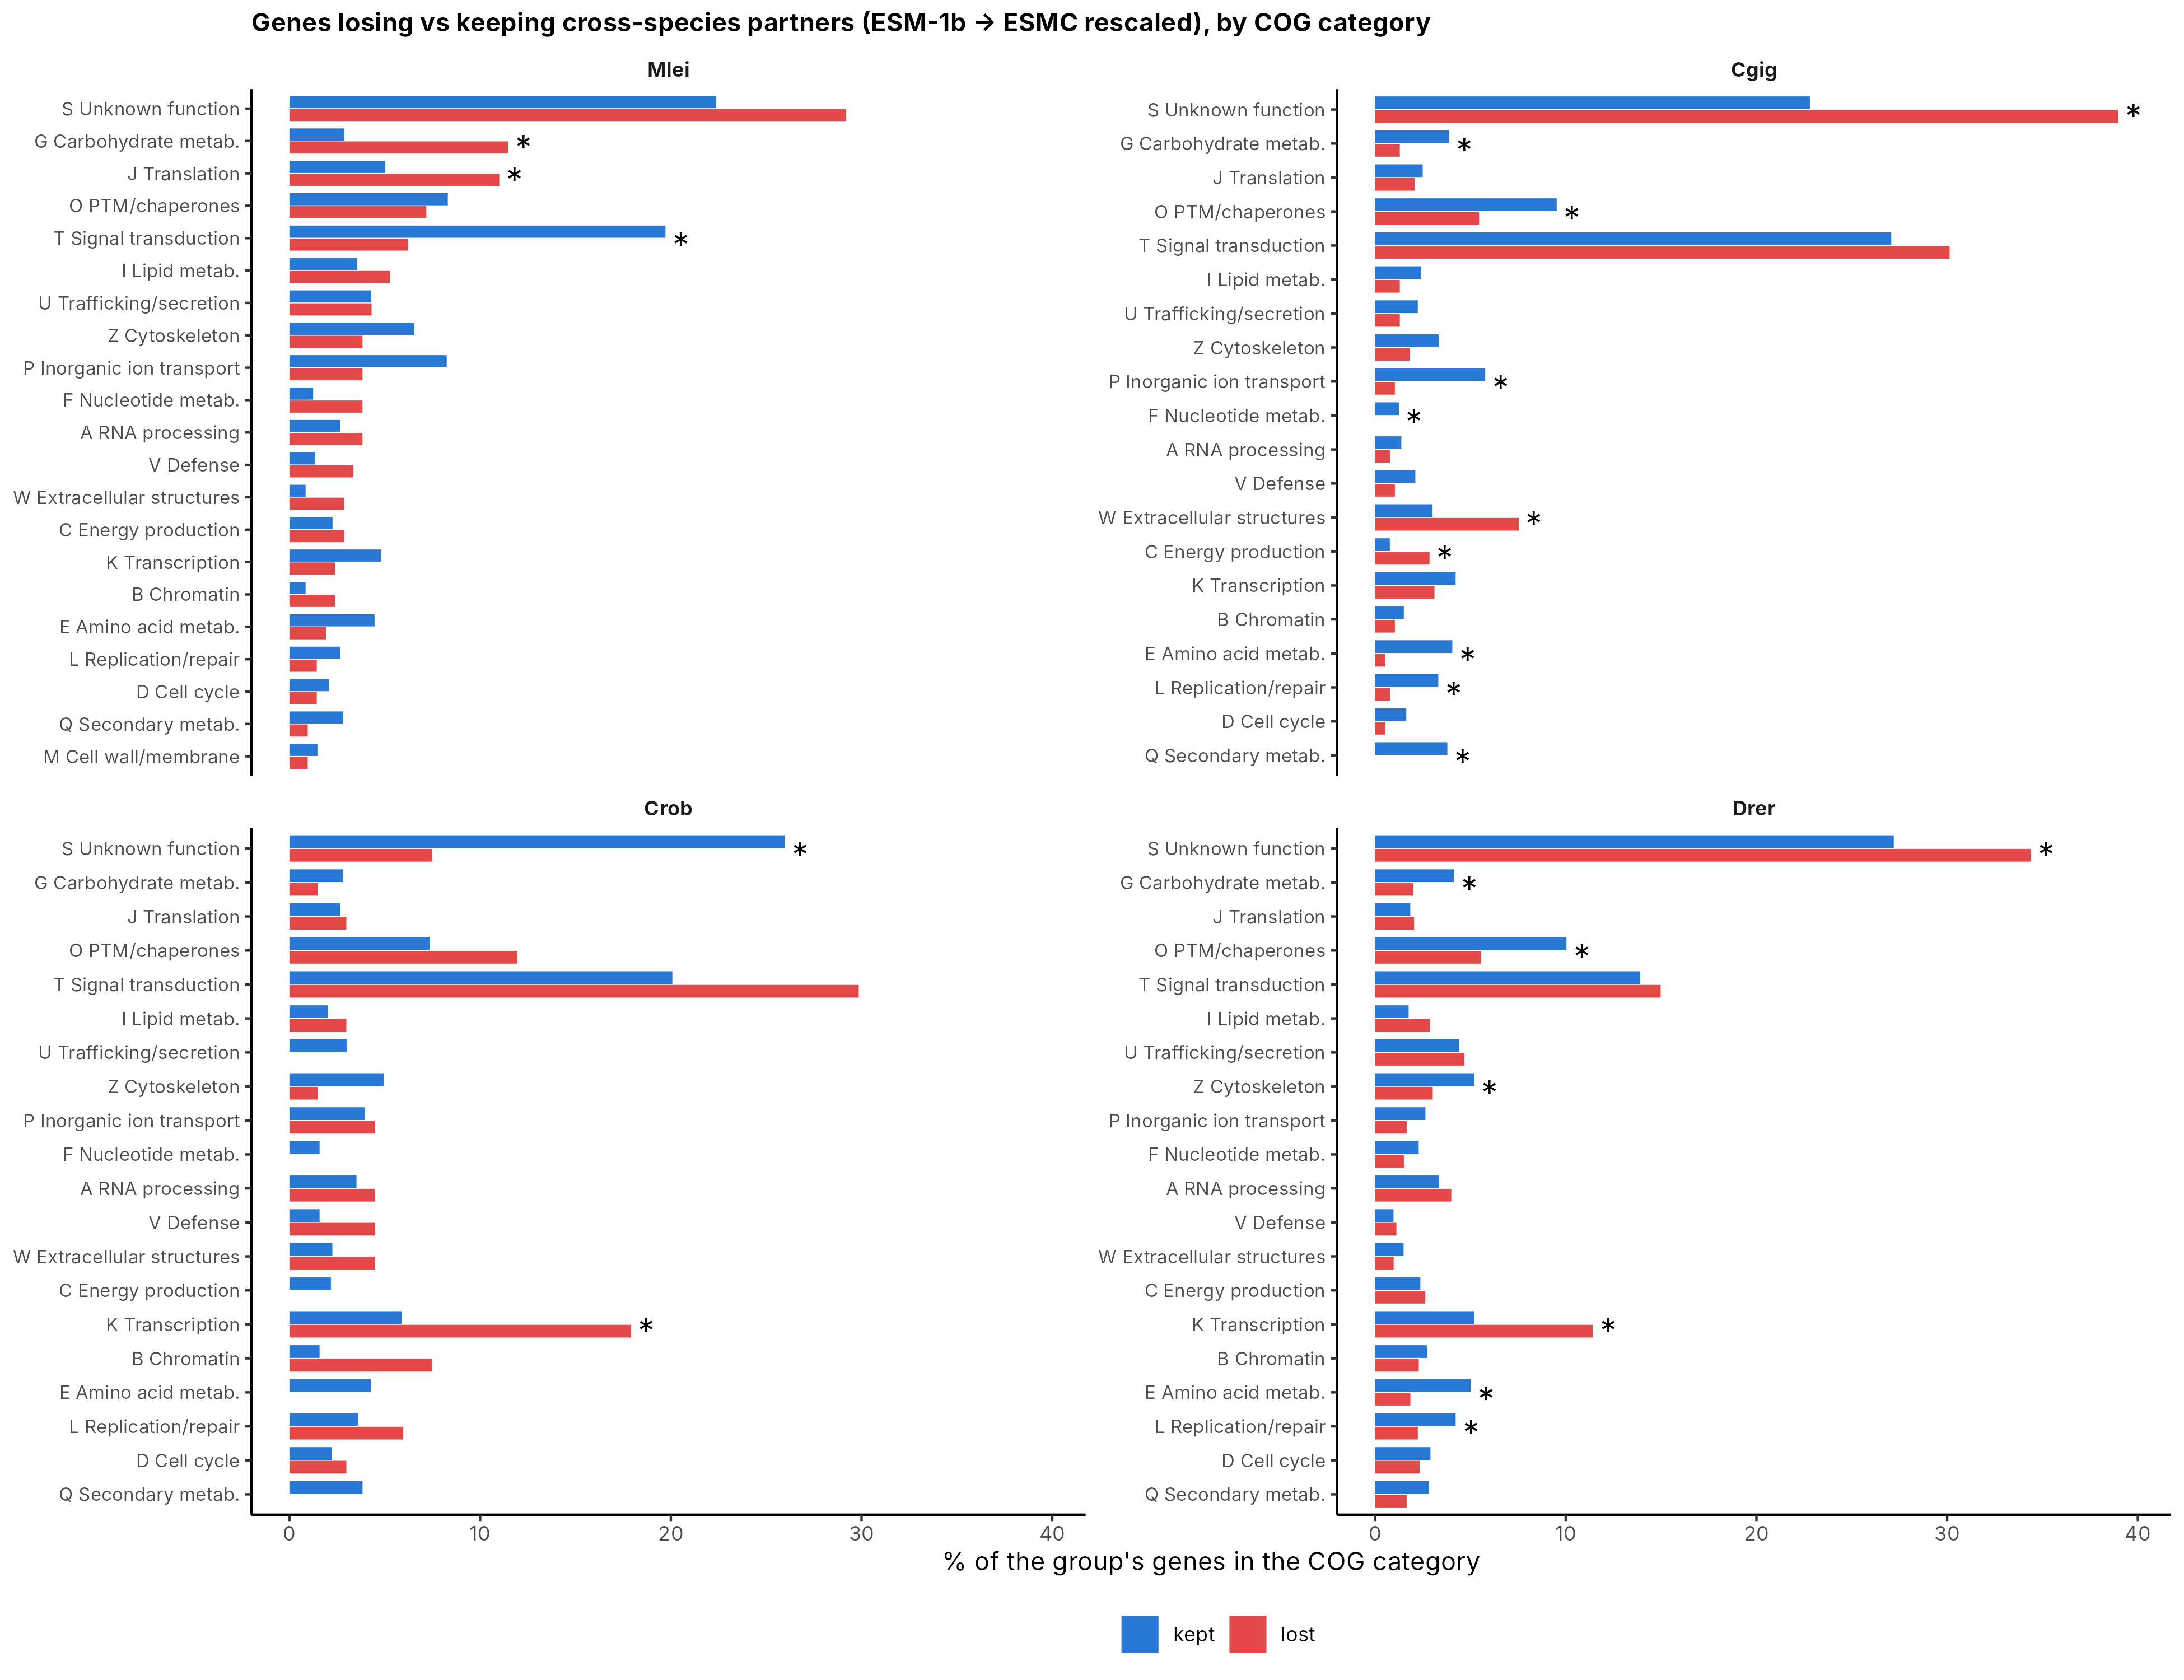
- Kept genes are conserved housekeeping families (Figure 7). In zebrafish and oyster, kept genes are enriched for amino-acid and carbohydrate metabolism, protein modification/chaperones and DNA replication/repair (plus cytoskeleton in zebrafish). In Mnemiopsis, kept genes are enriched for signal transduction.
- Whole macrogenes that survive (best-match Jaccard ≥ 0.5): 645 of 2,997 ESM-1b macrogenes (22%). The largest stable 4-species examples are deeply conserved families:
What changes
- Losses are concentrated in zebrafish. 27% of zebrafish genes lose all invertebrate partners under ESMC (vs 4–9% for invertebrates). Of the 1,526 ESM-1b macrogenes joining zebrafish with invertebrates, ESMC fully separates the zebrafish genes in 874 and keeps them together in 239.
- Often the invertebrates stay together and only zebrafish splits off, e.g. calmodulin-like (CALML3/CABP2), kelch-like (KLHL7/8/10/12), zinc-finger (ZNF/ZBTB), SLCO transporters and short-chain dehydrogenases (HSD17B/DHRS) macrogenes.
- Lost genes are enriched for fast-evolving or poorly characterized families (Figure 7): transcription regulators (COG K; zebrafish 11% of lost vs 5% of kept; also Ciona) and unknown-function genes (COG S; zebrafish 34% vs 27%; oyster 39% vs 23%).
- Immune genes. 1,194 zebrafish genes carry an immune or defense GO term; 305 of them lose their invertebrate links under ESMC (vs 5–47 per invertebrate), e.g. il6 and epoa/b (cytokines), cd63 (with oyster and Ciona tetraspanins), calcr (with oyster class B GPCRs), siva1 (with oyster BIRC3). Not every lost link was correct under ESM-1b (e.g. mavs grouped with unrelated TACC3/NUP153).
5. What does ESMC gain?
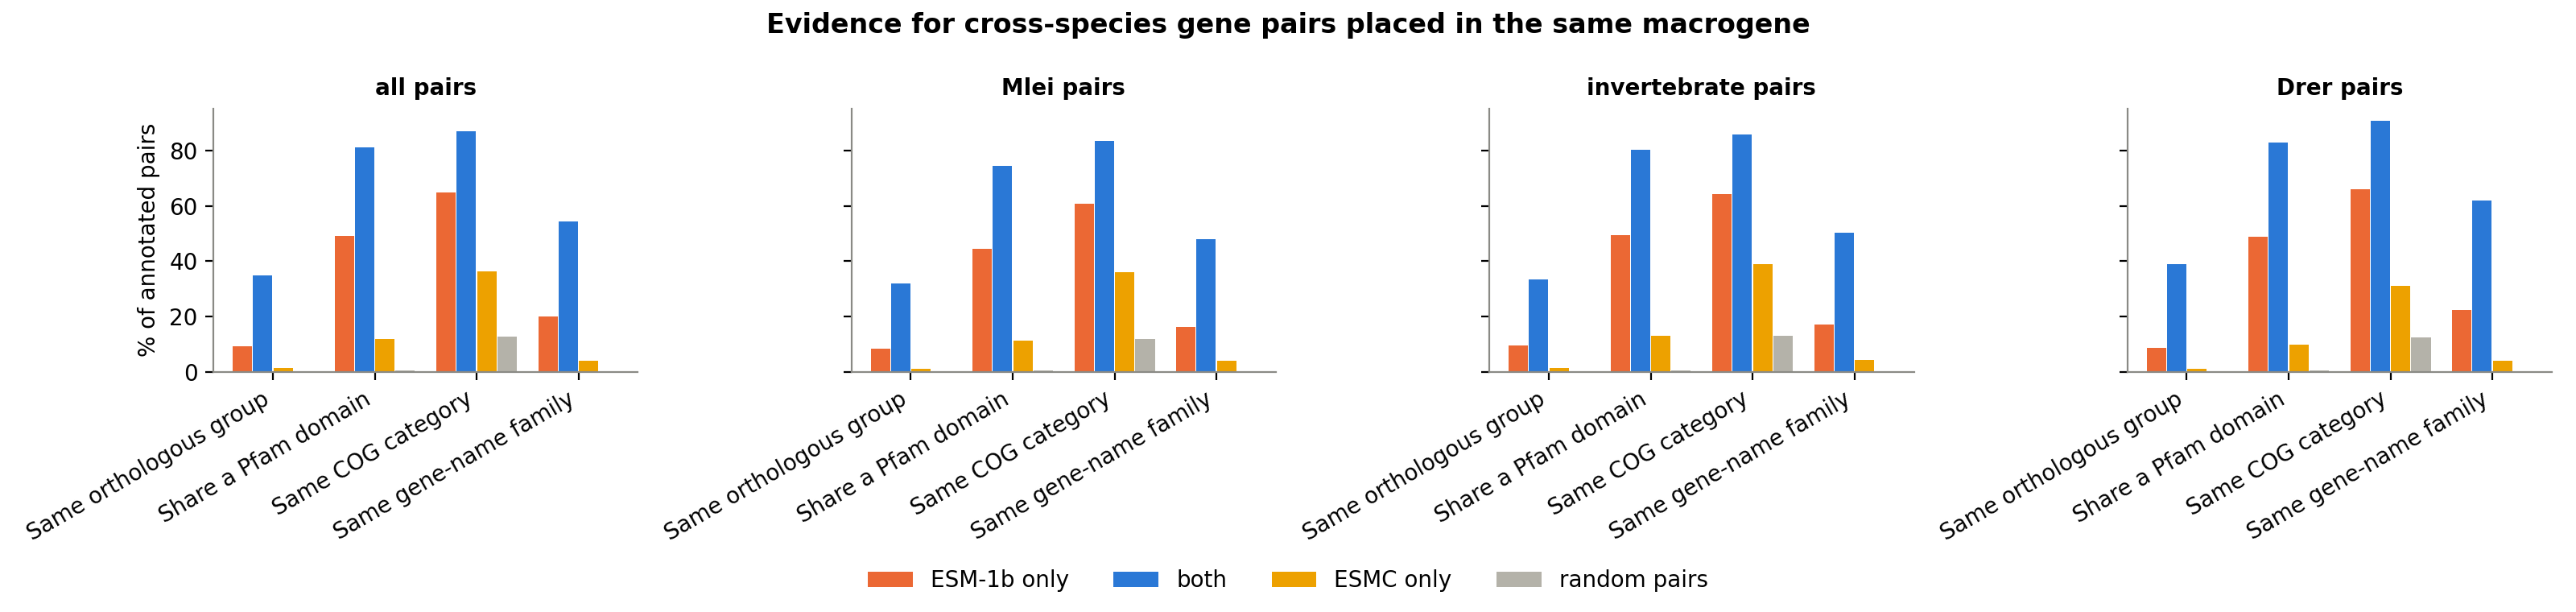
The ortholog benchmark can only reward links that eggNOG already knows, so a model that finds distant homologs could be under-scored. If ESMC does this, it should show up in the cross-species gene pairs that only ESMC puts together. We checked those pairs with evidence that does not depend on orthologous groups:
- Shared Pfam domain: the two proteins contain at least one protein domain in common (domain-level relatedness; weaker than orthology, but it can catch distant relationships).
- Same COG category: same broad functional class (unknown-function genes excluded).
- Same gene-name family: gene names share a family root (e.g. KLHL7 and KLHL10).
- Most ESMC-only links have no supporting evidence. Only 12% share even a protein domain, vs 49% of ESM-1b-only links. They are better than random (0.5%), so they are not pure noise, but about 4× weaker than what ESM-1b adds.
- The same holds for Mnemiopsis (11% vs 45% sharing a domain), where distant homologs would matter most, and for invertebrate-only pairs (13% vs 50%).
- Gained genes are not mainly unannotated genes. Genes that gain cross-species partners under ESMC are annotated about as often as other genes (e.g. Mnemiopsis 46% vs 51%), so ESMC is not filling in eggNOG’s blind spots.
- A minority of ESMC-only macrogenes do have strong domain support. Of the 952 ESMC macrogenes whose cross-species links are ≥80% new, most have little support (median 4% of pairs share a domain), but some group genes by protein superfamily rather than orthology, e.g. rhodopsin-like GPCRs (7tm_1; mostly Mnemiopsis with Ciona), Ig-domain adhesion proteins, claudins, MFS transporters, WD40 proteins, C-type lectins with TNF receptors (oyster + Ciona), TRIM/PML/NLRC5 and PARP14/DTX3L (interferon-related in vertebrates). These are plausible family-level links worth a closer look, e.g. with structural comparison (Foldseek).
Interpretation
- ESMC does not find a different but equally valid set of homologs; it finds fewer. Its new cross-species links rarely share an OG (1%) or even a protein domain (12%, Table 10), while the links it drops include many real ones. A small set of ESMC-only macrogenes group protein superfamilies (GPCRs, lectins, Ig-domain proteins) and may be worth following up.
- The losses fall hardest on zebrafish, our only vertebrate and the best-annotated immune reference. That matters for annotating immune cell types across phyla.
- What is robust to model choice: invertebrate–invertebrate sharing, conserved housekeeping and structural families (dyneins, tubulins, actins, tektins, T-box factors, annexins), and the canonical-run structure when urchin is dropped. Conclusions resting on these are not sensitive to the embedding choice.
Caveats
- eggNOG is sequence-based. It may favour a model whose similarity tracks sequence; a model capturing more remote structural similarity could be under-scored. A 2× gap that is already present before SATURN, and that survives standard fixes, is hard to explain this way.
- This tests the embeddings as delivered, not ESMC in general. If they come from before the final normalization layer, re-extraction could change the result. To be preferred, it would need to beat ESM-1b on Table 3 and Table 4 (61% after the best fix).
- Macrogene-only runs. Cell-level integration was not compared; it requires full training.
- eggNOG OG coverage is uneven (Mnemiopsis 50%, oyster and Ciona 63%, zebrafish 99% of genes), which lowers absolute scores for Mnemiopsis but affects all models equally.
References
- Rives A. et al. (2021) Biological structure and function emerge from scaling unsupervised learning to 250 million protein sequences. PNAS 118:e2016239118.
- ESM Team / EvolutionaryScale (2024) ESM Cambrian. https://huggingface.co/multimolecule/esmc-600m
- Rosen Y. et al. (2024) Toward universal cell embeddings: integrating single-cell RNA-seq datasets across species with SATURN. Nature Methods 21:1492–1500.
- Timkey W., van Schijndel M. (2021) All bark and no bite: rogue dimensions in transformer language models obscure representational quality. EMNLP 2021. https://aclanthology.org/2021.emnlp-main.372
- Mu J., Viswanath P. (2018) All-but-the-top: simple and effective postprocessing for word representations. ICLR 2018. https://arxiv.org/abs/1702.01417
- Cantalapiedra C.P. et al. (2021) eggNOG-mapper v2. Molecular Biology and Evolution 38:5825–5829.
Back to top