Analysis·Project Mnemiopsis Phagocytes·Tools OrthoFinder 3.1.0 SATURN ESM-1b ESMC-600M (FANTASIA v4) eggNOG-mapper Python
- OrthoFinder placed 83.3% of the 91,104 proteins (one per gene, four species) in 12,254 orthogroups; 4,987 contain all four species and 2,577 of those are single-copy. Zebrafish genes often come in pairs relative to the other species (teleost genome duplication), so zebrafish has the fewest 1:1 orthologs. OrthoFinder did not write Metazoa-level hierarchical orthogroups (section 1).
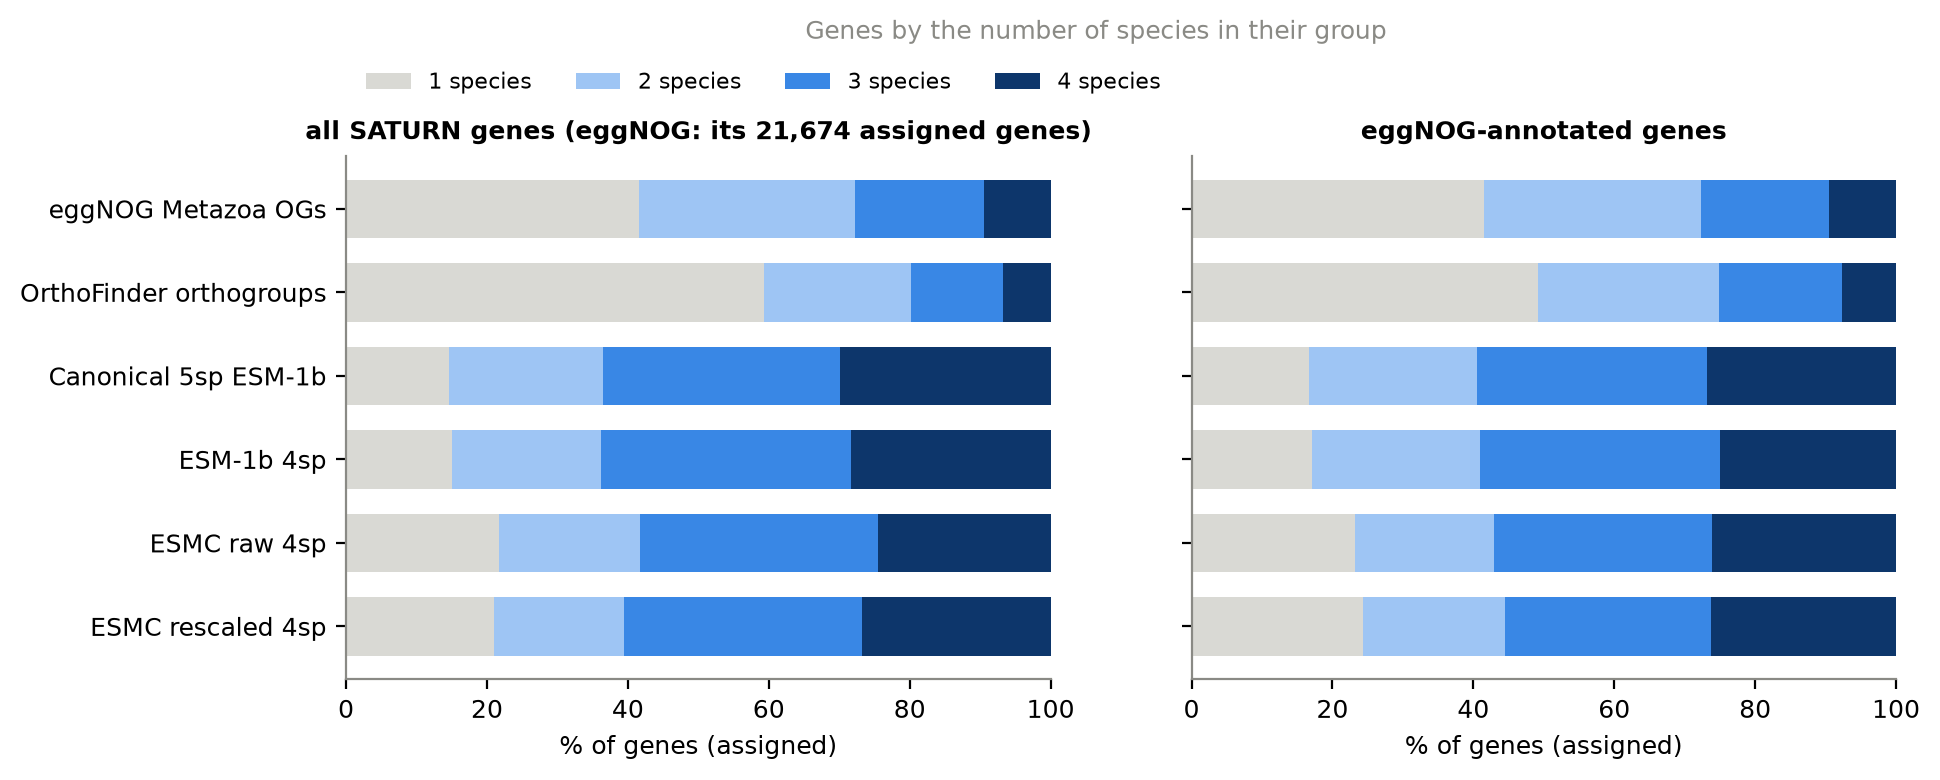
- The two orthology references agree on how much cross-species signal there is. Only about a third (Mnemiopsis, oyster) to a half (Ciona, zebrafish) of SATURN genes share a group with another species’ SATURN gene, whether eggNOG or OrthoFinder is used (Table 8).
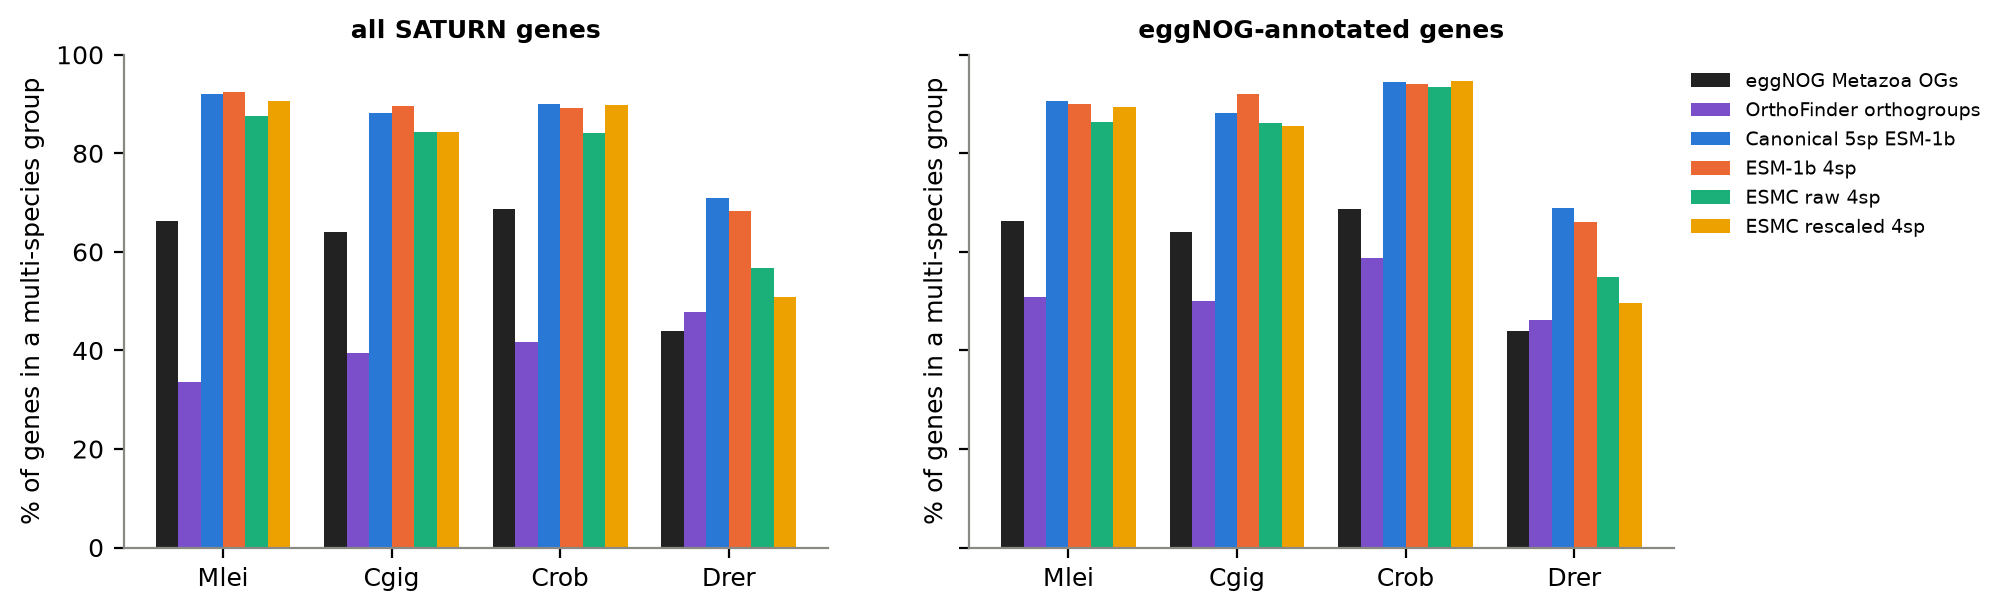
- Macrogenes put almost everything with another species: 84–92% of invertebrate and Ciona genes, and 51–71% of zebrafish genes, sit in multi-species macrogenes (Figure 2).
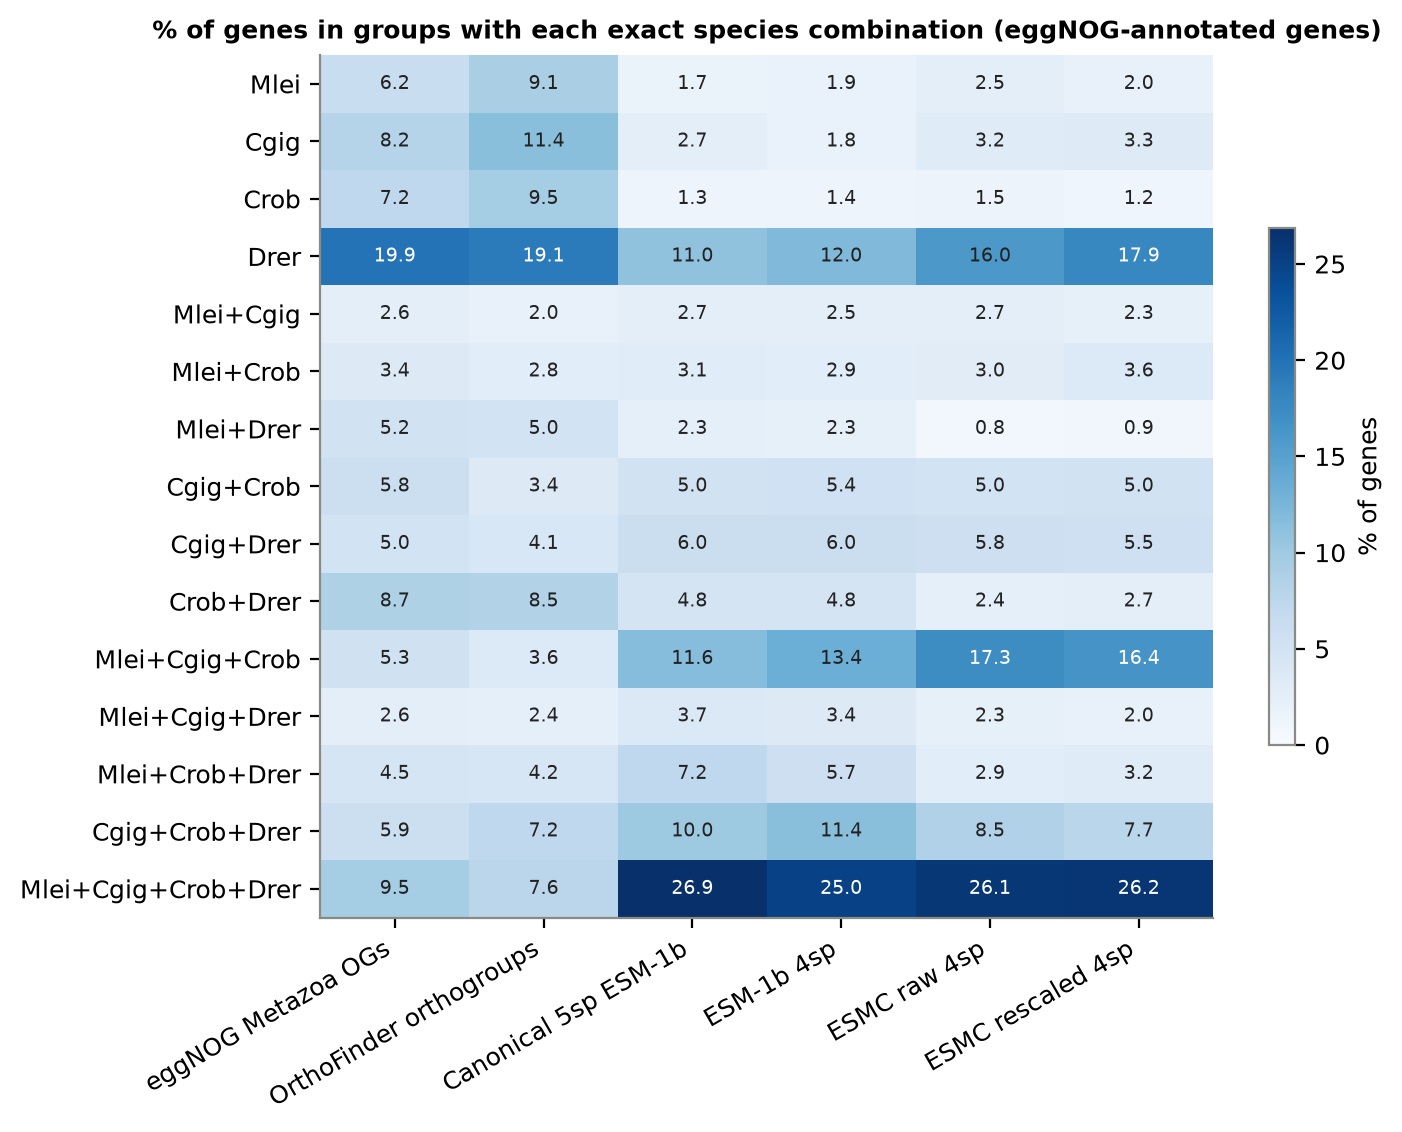
- Macrogenes over-group the three non-vertebrates and set zebrafish apart. Mnemiopsis + oyster + Ciona groups hold 12–17% of genes in macrogenes vs 3.6–5.3% in orthogroups, while Ciona + zebrafish groups, the closest pair by orthology, are under-represented (Figure 3, Table 9). This is strongest with ESMC.
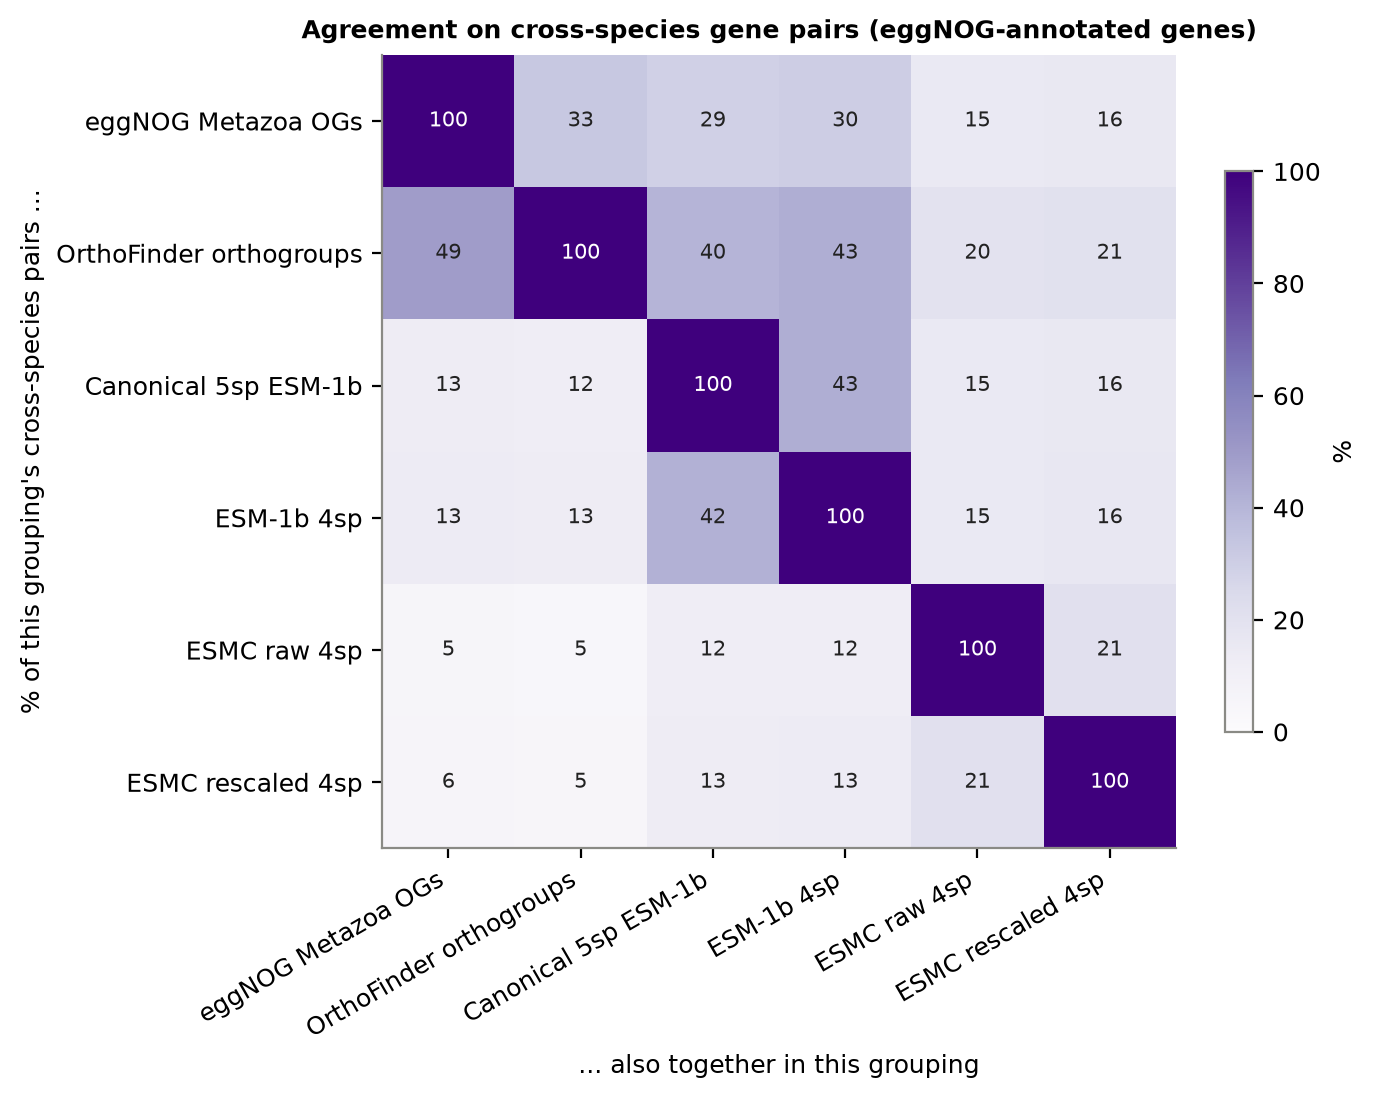
- Agreement on gene pairs is low everywhere. The two orthology references share 33–49% of their cross-species pairs; ESM-1b macrogenes recover 30–43% of orthology pairs (ESMC 15–21%); and two ESM-1b runs on different species sets share only ~42% of their pairs (Figure 4).
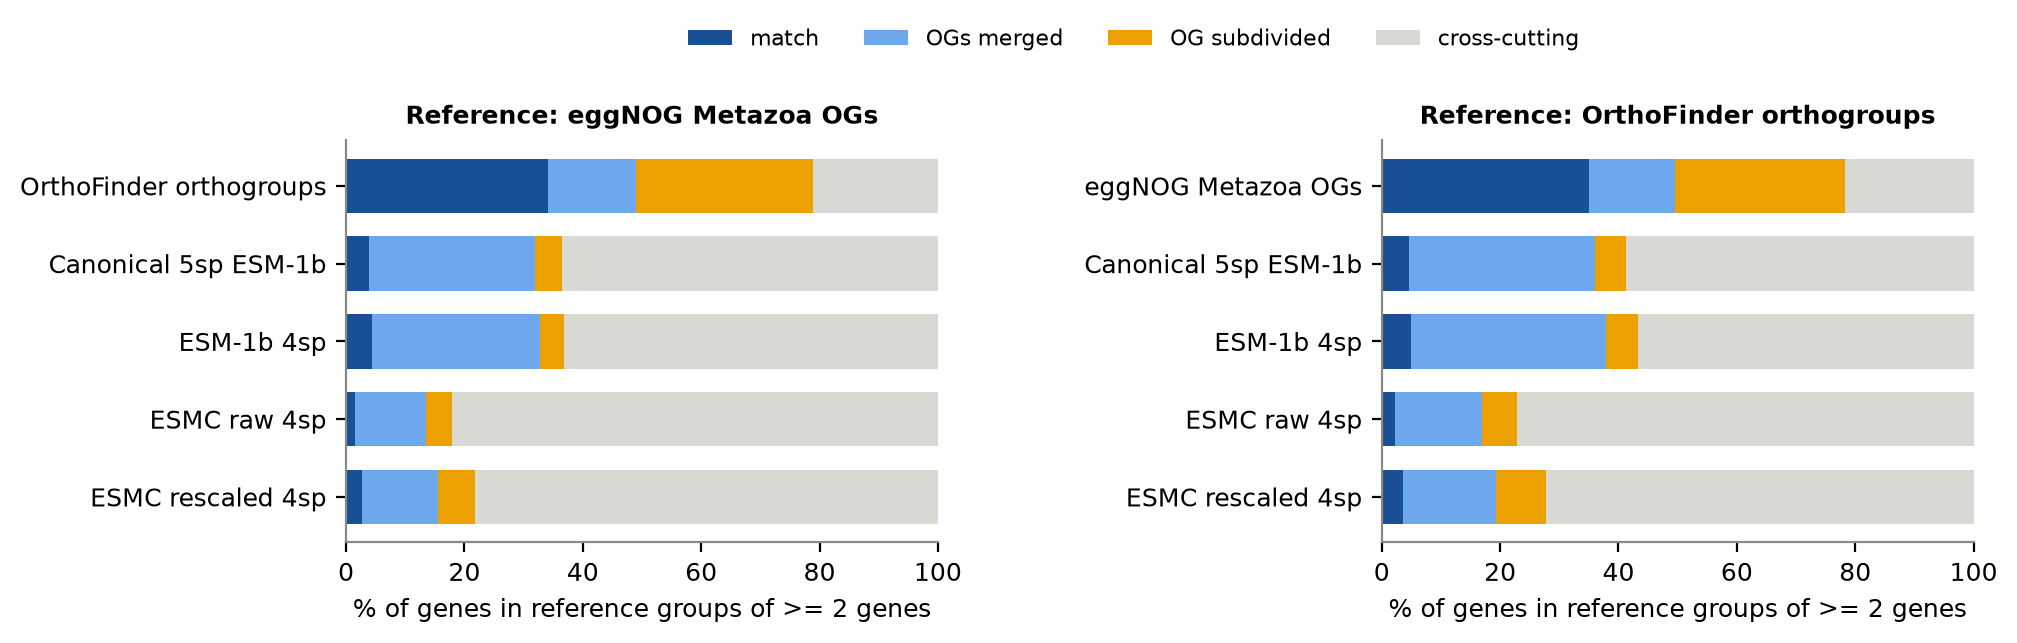
- How orthogroups sit in macrogenes does not depend on the reference: ESM-1b mostly merges whole orthogroups or cuts across them (5% match, 29–33% merged); ESMC cuts across them for three-quarters of genes (Figure 5).
This entry follows Oct 9 (section 6 of which summarizes the OrthoFinder benchmark scores). Here: what OrthoFinder produced, then a side-by-side of six ways of grouping the same SATURN genes — two orthology references and four macrogene sets — asking which species end up together and how orthogroups split or merge.
1. The OrthoFinder run and its outputs
OrthoFinder 3.1.0 on the four proteomes (longest protein per gene, same protein → gene bridges as the SATURN embeddings; 06a), with MSA gene trees (-M msa -A mafft -T fasttree) and the fixed species tree (Mlei,(Cgig,(Crob,Drer))). 70 min on 16 cores, 15.9 GB peak memory (Pegasus, normal queue; environment rebuilt the same day, see that entry).
- Oyster has the most lineage-specific genes: 35% of its genes are in oyster-only orthogroups, consistent with its many lineage-specific gene-family expansions. Mnemiopsis and Ciona have the most genes with no orthogroup at all (~24–25%).
- Zebrafish genes usually come in pairs relative to the other species. 8,141 zebrafish genes share a single Ciona ortholog with another zebrafish gene (many-to-one), and 2,463 Ciona genes have several zebrafish orthologs, as expected after the teleost genome duplication. As a result, zebrafish has fewer 1:1 orthologs with Ciona (4,270) than oyster does (5,737), and the fewest of all with Mnemiopsis (3,237). This duplication may also contribute to the zebrafish-only macrogenes in section 3 (paralog pairs grouped together); not tested here.
What the results folder contains, and what we use:
No Metazoa-level HOGs. OrthoFinder wrote HOGs only for N1 and N2, not for the root, the only node that includes Mnemiopsis; a 3-species test behaved the same way. The comparisons below therefore use OrthoFinder orthogroups. Adding a choanoflagellate outgroup in the planned 6-species run should make the animal node a non-root node.
Coverage of SATURN genes. Every SATURN gene is in the OrthoFinder tables (the gene bridges work). Genome-wide, the share of SATURN genes whose orthogroup includes another species follows the divergence gradient: Mnemiopsis 43.9%, oyster 46.6%, Ciona 53.2%, zebrafish 78.0%. Within the SATURN gene set (only other species’ SATURN genes counted), the shares are lower (Table 8).
2. Species span: how many species share each group
- Orthogroups are small and mostly single-species within the SATURN genes: 42% (eggNOG) and 59% (OrthoFinder) of genes have no other species’ SATURN gene in their group. OrthoFinder’s higher share comes from the ~10,000 genes eggNOG cannot annotate; on the same genes it is 49% (Figure 1, right).
- Macrogenes are the reverse: 78–85% of genes sit in groups spanning ≥ 2 species, and 25–30% in groups with all four. ESMC leaves more genes in single-species macrogenes (21–22% vs 15%), as on Oct 8.
3. Which species end up together
- The two orthology references give nearly the same per-species picture once eggNOG’s unannotated genes are counted: a third of Mnemiopsis genes, and under half for every species, have a SATURN-gene ortholog in another species.
- Zebrafish is the exception for macrogenes: it is the species most often in a multi-species orthogroup (OrthoFinder) but the least often in a multi-species macrogene, especially with ESMC (51–57%).
- By orthology, Ciona’s most frequent partner is zebrafish (OrthoFinder: 27% of Ciona genes; Ciona + zebrafish groups hold 8.5–8.7% of genes), as expected for two chordates.
- Macrogenes instead group Ciona with Mnemiopsis and oyster (70–80% of Ciona or Mnemiopsis genes share a macrogene with the other), and Mnemiopsis + oyster + Ciona groups hold 12–17% of genes vs 3.6–5.3% in orthogroups (Figure 3). Groups pairing zebrafish with one other species are under-represented (Mnemiopsis + zebrafish: 0.8–0.9% with ESMC vs 5% in orthogroups).
- Reading: in embedding space, zebrafish genes sit apart from the other three species. This fits the species signal seen in the embeddings on Oct 6, and is strongest for ESMC. Whether it reflects real divergence, uneven training data (vertebrates are better sampled) or an embedding artefact is open; a fifth species (human or fly) will help separate these.
4. Agreement on gene pairs
- The references themselves agree only partly: half of OrthoFinder’s pairs are eggNOG pairs, but only a third of eggNOG’s are OrthoFinder pairs (eggNOG groups more genes together).
- Macrogenes make 2–4× more cross-species pairs than orthogroups, and 87–95% of them are not orthology pairs (or involve genes whose orthologs are not among the SATURN genes).
- Macrogene sets agree poorly with each other. The two ESM-1b runs, same model with a different species set and training run, share ~42% of pairs; ESMC raw vs rescaled ~21%; ESM-1b vs ESMC 12–16%. This matches Oct 9: aggregate scores are reproducible, individual macrogene memberships are not.
5. How orthogroups split and merge across groupings
- eggNOG and OrthoFinder have similar granularity but cut genes differently: a third of genes are in identical groups, and OrthoFinder splits eggNOG OGs about twice as often as it merges them.
- Macrogenes relate to both references the same way. ESM-1b keeps orthogroups whole (match + merged) for 33–38% of genes; ESMC for 14–19%. Nearly all the rest are cross-cutting: their orthogroup is split across macrogenes that also contain other orthogroups.
Interpretation
- Orthology and embeddings disagree about how much is shared between species. By sequence orthology, at most half of the SATURN genes have a cross-species partner among the other species’ SATURN genes; macrogenes give a partner to 84–92% of non-vertebrate genes. The difference is the set where embeddings are expected to add something (remote homologs), and also where they can add noise.
- The pattern of who groups with whom is not phylogenetic. Macrogenes join Ciona with the ctenophore and oyster more than with zebrafish. Together with the species signal in the embeddings, this suggests a zebrafish (vertebrate) offset in embedding space rather than a biological grouping, and argues for checking species offsets before reading cross-species macrogenes as homology.
- The two orthology references are interchangeable for these questions, which makes the ESM-1b vs ESMC conclusions robust to the choice of reference (as in Oct 9 section 6).
Caveats
- Everything is counted within the SATURN gene set. A gene can look single-species because its ortholog was not a highly variable gene in the other species; “1:1” means 1:1 among SATURN genes.
- eggNOG is defined only on 68% of genes, so its numbers come from a different (better-conserved) gene set unless the annotated-genes universe is used.
- No Metazoa-level HOGs: OrthoFinder orthogroups lump all duplications since the last common ancestor; HOGs would separate older from newer paralogs.
- One macrogene run per model at K = 3,000; Oct 9 shows the same model ranking at every K.
References
- Emms D.M., Kelly S. (2019) OrthoFinder: phylogenetic orthology inference for comparative genomics. Genome Biology 20:238. https://doi.org/10.1186/s13059-019-1832-y
- Emms D.M., Liu Y., Belcher L., Holmes J., Kelly S. (2025) OrthoFinder 3 (bioRxiv; cited by the program).
- Huerta-Cepas J. et al. (2019) eggNOG 5.0. Nucleic Acids Research 47:D309–D314. https://doi.org/10.1093/nar/gky1085
- Cantalapiedra C.P. et al. (2021) eggNOG-mapper v2. Molecular Biology and Evolution 38:5825–5829.
- Rosen Y. et al. (2024) SATURN. Nature Methods 21:1492–1500. https://doi.org/10.1038/s41592-024-02191-z
- Rosenberg A., Hirschberg J. (2007) V-measure. EMNLP-CoNLL 2007.
- Hubert L., Arabie P. (1985) Comparing partitions. Journal of Classification 2:193–218.
Back to top