SATURN: what the ESMC embeddings are, how macrogenes relate to orthogroups, and a K sweep
- The ESMC vectors we used come from a different point in the model than the ESM-1b vectors. FANTASIA’s
layer_0is the last ESMC layer before the model’s final normalization; SATURN’s ESM-1b vectors are taken after it (Table 3). This explains the vector lengths seen on Oct 6, and why rescaling could not fix them. - SATURN uses the gene embeddings in two places (KMeans and a pretraining loss), and macrogene membership is set almost entirely by the starting KMeans: 97% of genes keep their macrogene through pretraining (Table 10).
- Macrogenes are ~3× coarser than eggNOG orthogroups (OGs): they mostly merge OGs, but also cut across them (Table 5).
- Low ortholog recall is partly driven by a few giant gene families; even so, only ~50% of clean 1:1 ortholog sets are grouped with ESM-1b, vs ~25% with ESMC (Table 6).
- On the SATURN paper’s own homology test, 57–75% of ESM-1b macrogenes contain a cross-species pair sharing a protein domain, following the divergence gradient; ESMC is lower for every species pair (Table 7).
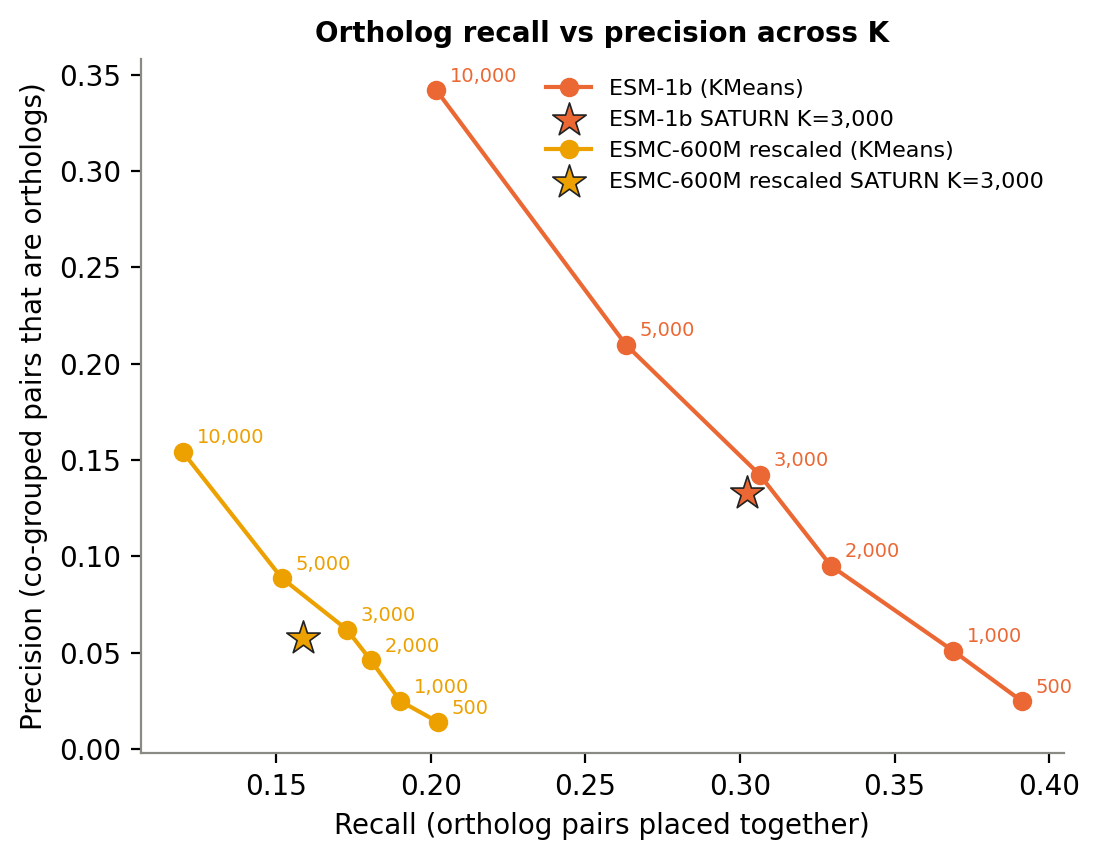
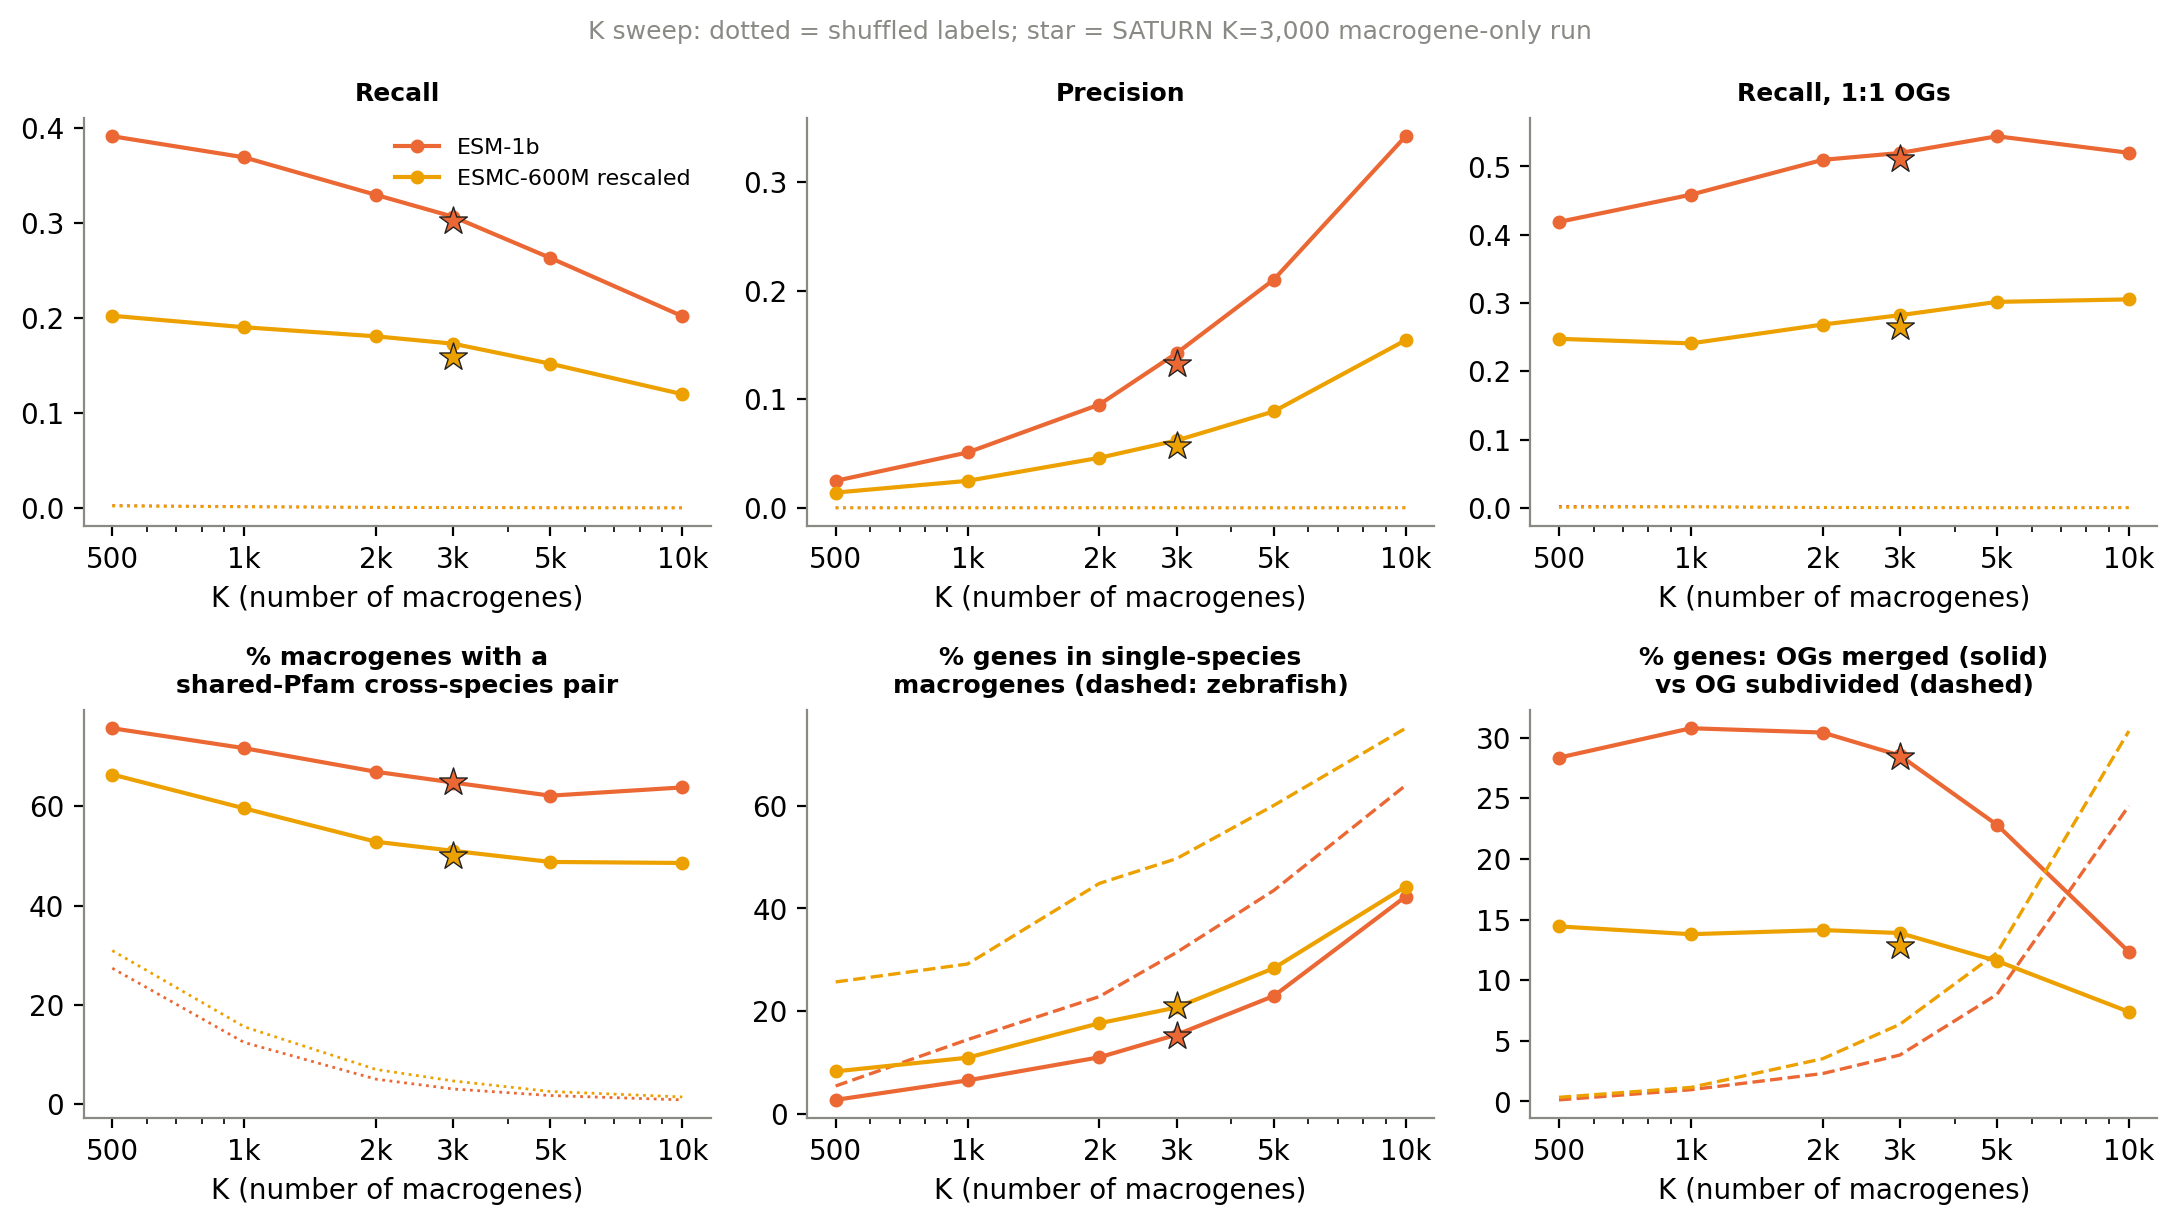
- K sweep: ESM-1b recovers more orthologs with fewer wrong pairs than ESMC at every number of macrogenes from 500 to 10,000; the model comparison does not depend on K (Figure 4).
- OrthoFinder (de novo orthogroups) gives the same answer as eggNOG (added Oct 15): ESM-1b recovers about twice as many orthologs as ESMC at every K, and macrogenes are still ~3.5× coarser than orthogroups on the same genes (Table 12). Absolute recall is higher against OrthoFinder, mainly because fewer giant gene families dominate the pair counts.
This entry follows Oct 6 and Oct 8. It covers: background on the ESM models; a code-level check of how each set of embeddings was produced and how SATURN uses them; how macrogenes relate to orthogroups; what the number of macrogenes (K) does, compared with the SATURN paper; a K sweep; and the setup for an OrthoFinder comparison.
Key terms
| Term | Meaning here |
|---|---|
| Residual stream / hidden state | The running vector a transformer keeps for each amino acid, updated layer by layer. Its values grow with depth. |
| Final normalization (LayerNorm) | The last step before the model’s output. For each amino acid separately it subtracts the vector’s own mean, divides by its spread, and re-weights each dimension with learned weights. |
| Pre-norm / post-norm | A hidden state taken before / after that final normalization. |
| Pooling | Averaging the per-amino-acid vectors into one vector per protein (then per gene, averaging isoforms). |
K (--num_macrogenes) |
The number of macrogenes SATURN builds; it is set by the user, not discovered. 3,000 in our runs. |
| Orthogroup (OG) | A group of genes descending from one ancestral gene. Here: eggNOG Metazoa OGs (and OrthoFinder groups, section 6). |
| 1:1 OG | An OG with exactly one gene per species present: the cleanest ortholog sets. |
| Homogeneity / completeness | 1 = every macrogene holds a single OG / every OG sits in a single macrogene. |
| OGs merged / OG subdivided / cross-cutting | Per gene: its OG is kept whole but shares a macrogene with other OGs (macrogenes coarser) / its OG is split, but each piece has a macrogene to itself (macrogenes finer) / both at once. |
| Recall / precision | As on Oct 8: share of true ortholog pairs placed in the same macrogene / share of co-grouped cross-species pairs that are orthologs. |
1. Background: how the ESM models have changed
All ESM models are trained the same way: hide some amino acids in millions of protein sequences and learn to guess them. To guess well, a model has to learn which positions vary together, which residues fit which folds, and which proteins belong to the same family. The embedding is the model’s internal summary of a protein.
| Model | Year | What changed | What improved |
|---|---|---|---|
| ESM-1b | 2019–21 | ~650M parameters, ~27M UniRef50 sequences | showed that structure and function emerge from sequence alone (Rives et al. 2021) |
| ESM-2 | 2022 | modern architecture, 8M–15B parameters | structure (contacts, ESMFold) improves with scale (Lin et al. 2023) |
| ESM3 | 2024 | generative model over sequence, structure and function | protein design (Hayes et al. 2025) |
| ESMC (ESM Cambrian) | Dec 2024 | ESM3’s representation-only sibling; much more training data, including metagenomes | reported to match or beat much larger ESM-2 models (ESM Team 2024) |
“Improved” means better on standard benchmarks: structure prediction, mutation effects, and function prediction for proteins close to well-studied ones. None of these tests whether a ctenophore gene and its zebrafish ortholog land in the same group. Three findings from the field matter here:
- Embeddings encode where a protein comes from. Simple classifiers on pooled embeddings predict a protein’s taxonomy, and ESMC-600M was the strongest of the models tested at telling same-species from different-species pairs (Hallee et al. 2025). That is useful for taxonomy but works against SATURN, which needs orthologs from different species to look alike. It fits the extra species signal in ESMC seen on Oct 6.
- Training data is uneven across the tree of life. Model likelihoods favour well-sampled lineages such as animals and especially mammals, tracking how often each lineage appears in sequence databases (Ding & Steinhardt 2024; tested on likelihoods, not embeddings). Our four species span exactly that imbalance.
- Bigger is not always better for embeddings. For using embeddings as features, medium-sized models (ESM-2 650M, ESMC 600M) perform nearly as well as the largest ones, and mean-pooled embeddings work best (Vieira et al. 2025).
2. Code check: what each pipeline extracts, and how SATURN uses it
What is in each set of vectors
I read the code that produced each set of embeddings: FANTASIA’s ESMC module (protein_information_system 3.1.2, used by FANTASIA 4.1 on PyPI), EvolutionaryScale’s esm package (3.4.1), and Meta’s fair-esm used by SATURN’s ESM-1b pipeline.
| ESM-1b (SATURN pipeline) | ESMC-600M (FANTASIA v4, type_5/layer_0) |
|
|---|---|---|
| Layer | final layer (33) | final transformer block (36); layer_index 0 = last, 1 = second-to-last, … |
| Before or after final normalization | after (fair-esm stores layer 33 after emb_layer_norm_after) |
before: FANTASIA takes hidden_states[-1]; in esm, hidden states are collected before self.norm, while the normalized output is returned separately as embeddings |
| Pooling | mean over residues, start/end tokens excluded | mean over residues, start/end tokens excluded ([0, 1:-1].mean) |
| Post-processing | none | none |
| Precision | fp32 | model cast to fp32, but ESMC.logits() runs under bfloat16 autocast on GPU |
| Long proteins | first 1,022 aa | no truncation by default (max_sequence_length: 0); ESMC was trained up to 2,048 tokens |
| Vector length | 16–20 | 1,700–8,900 |
FANTASIA computes the normalized embeddings too, but stores the hidden states when they are available. That is a sensible choice for FANTASIA’s own use: its GO transfer compares proteins by cosine distance (the default distance_metric), and nearest-neighbour lookups within one model are robust to this. SATURN needs something different: it clusters with Euclidean KMeans, and it assumes vectors comparable to the post-norm ESM-1b ones.
This answers questions 1–4 from the Oct 6 entry: layer_0 is the last block, taken before the final normalization, mean-pooled without special tokens, with no further processing. It also explains the Oct 6 observations: lengths in the thousands, ~5 effective dimensions, and PC1 tracking length (r = 0.96) are typical of raw residual-stream states, where a few dimensions carry very large values (Sun et al. 2024).
Why rescaling could not fix it. The final LayerNorm acts on each amino acid before averaging: it removes each residue’s shared offset, evens out its scale, and re-weights the 1,152 dimensions with learned weights, which tames the few dominant dimensions. Our 05e rescaling divided the already-averaged vector by one number, so it changed only the overall length and left the dominant dimensions in place. That is why rescaling moved the nearest-neighbour ortholog test only from 34% to 36%, while removing the top principal components (a crude way of removing dominant directions) helped more (49%; Oct 8).
How SATURN uses the gene embeddings
- Macrogene seeding:
make_centroidsrunsKMeans(n_clusters=K, random_state=seed)on the stacked raw vectors (Euclidean), then turns each gene’s distance ranks into starting weights. - Pretraining loss: the rank loss (paper equation 12;
gene_weight_ranking_loss) keeps gene-to-macrogene weights consistent with the cosine similarity of the raw embeddings. Cosine ignores length but not a shared dominant direction, which makes all genes look similar and flattens what this loss learns from. So the pre-norm issue reaches SATURN through both routes, and rescaling addressed only the first. - Fine-tuning: macrogene weights are frozen during metric learning (paper Methods;
--unfreeze_macrogenesis off by default). This confirms that the macrogene-only runs (pretraining + 1 epoch) capture the final macrogenes.
Other checks
- Stop codons:
*is not in ESMC’s vocabulary and FANTASIA does not strip it, so a trailing stop becomes an unknown token in the average. Worth checking whether the input FASTAs had trailing*. - Failed sequences: FANTASIA skips a protein that errors (it prints a message and continues), so coverage per species is worth comparing with the input FASTAs.
- Cgig gene set: the rescaled run had 106 Cgig HV genes that differ from the other runs. SATURN selects HV genes only among genes with embeddings, so the rescaled
.ptfile’s Cgig keys probably differ (e.g. dropped vectors). Minor (comparisons use common genes), but worth explaining. --embedding_modelis only a label when embedding paths are given in the input CSV.
What a like-for-like ESMC extraction would look like
Not run yet; for discussion with Ingrid:
- take
logits_output.embeddings(post-final-LayerNorm), mean-pooled over residues without start/end tokens (as for ESM-1b); - fp32 without autocast;
- strip trailing
*; choose a truncation policy deliberately; - same proteins and isoform-to-gene bridges as
05_convert_esmc_embeddings.py; - optionally also one or two middle layers, which often encode homology better than the last.
Then 05f, 05i and the K sweep below. To be preferred, ESMC would need to beat ESM-1b on those (e.g. > 61% nearest-neighbour ortholog hits after the best fix; higher recall and precision across K).
3. How macrogenes relate to orthogroups (05n)
Same 31,702 genes and four K = 3,000 runs as Oct 8; 21,674 genes have an eggNOG Metazoa OG. Each gene gets one OG (the one most of its proteins map to; 0.8% of genes map to more than one). Pooled recall reproduces the 05g benchmark exactly (0.289 / 0.300 / 0.150 / 0.157).
Counts and sizes
| Groups | Groups ≥ 2 genes | Singletons | Multi-species groups | All 4 species | Mean size | |
|---|---|---|---|---|---|---|
| eggNOG Metazoa OGs (annotated genes) | 10,443 | 4,565 | 5,878 | 3,511 | 220 | 2.1 |
| ESM-1b 4sp macrogenes (all genes) | 2,997 | 2,914 | 83 | 2,288 | 552 | 10.6 |
| ESMC rescaled 4sp macrogenes (all genes) | 2,989 | 2,680 | 309 | 1,739 | 391 | 10.6 |
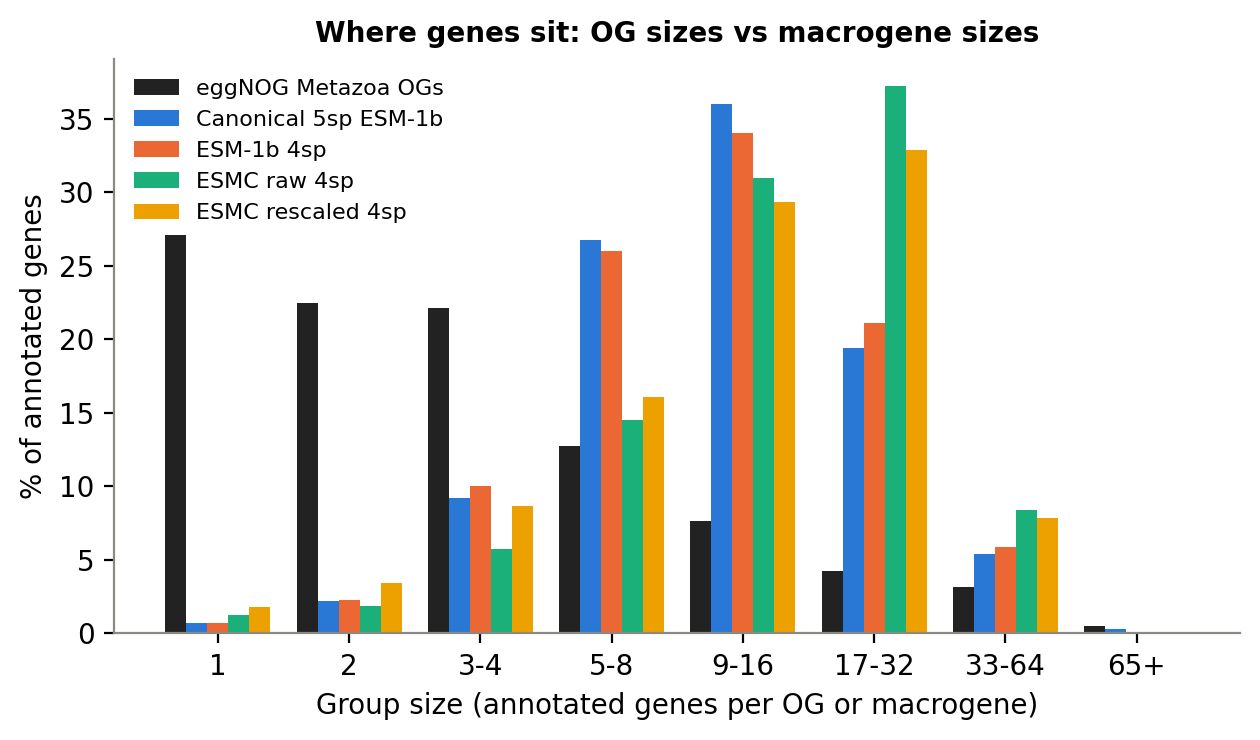
- There are ~3.5× more OGs than macrogenes. OGs are mostly 1–4 genes; macrogenes mostly 5–32 (Figure 1).
- 27% of annotated genes are in single-gene OGs: their orthologs exist but were not among the highly variable genes of the other species, so no grouping could link them here.
Nesting
| Homogeneity | Completeness | ARI | match | OGs merged | OG subdivided | cross-cutting | |
|---|---|---|---|---|---|---|---|
| ESM-1b 4sp | 0.81 | 0.94 | 0.21 | 4 | 28 | 4 | 63 |
| ESMC rescaled 4sp | 0.77 | 0.91 | 0.12 | 3 | 13 | 6 | 78 |
| Shuffled (ESM-1b) | 0.74 | 0.86 | 0.00 | 0 | 0 | 0.7 | 99 |
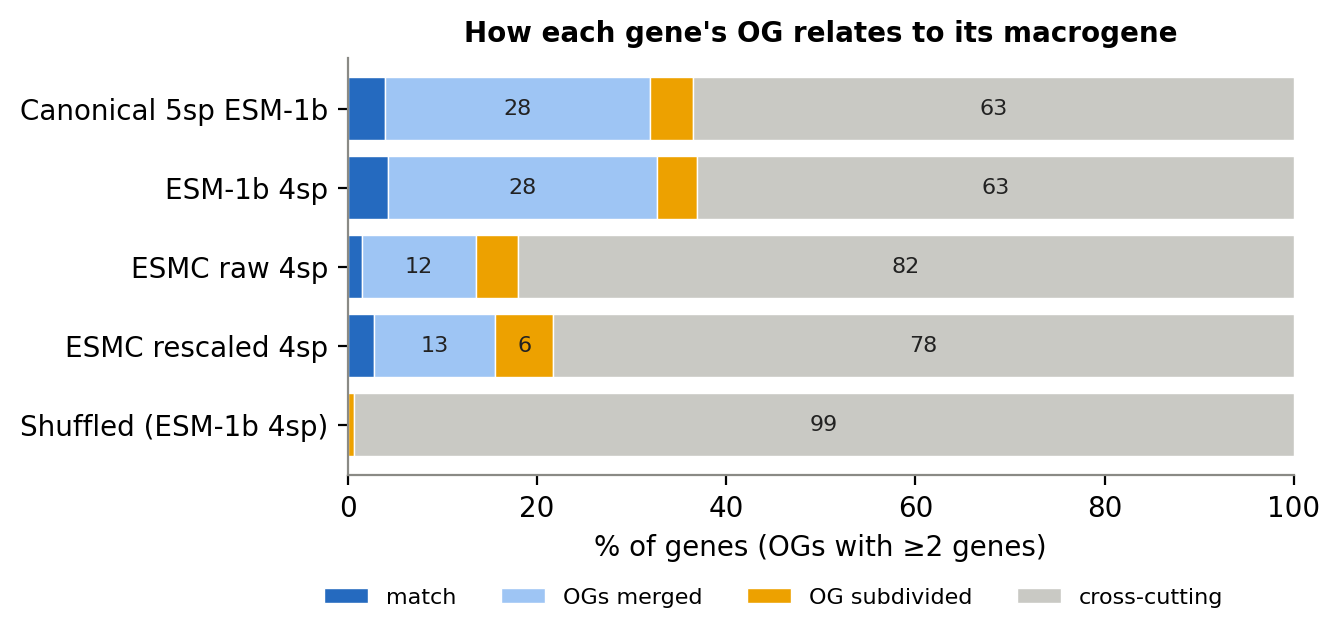
- Macrogenes mostly merge OGs (completeness > homogeneity; “OGs merged” 28% vs “OG subdivided” 4% with ESM-1b), as expected with ~10 genes per macrogene.
- But they also cut across OGs: most genes fall in the strict “cross-cutting” class (one stray gene is enough to count an OG as split).
- ESM-1b keeps about twice as many OGs whole as ESMC (Figure 2).
Is low recall driven by big families?
| OG size (genes) | Multi-species OGs | % of all OG pairs | Mean recall per OG, ESM-1b 4sp | ESMC rescaled 4sp |
|---|---|---|---|---|
| 2 | 1,745 | 6.5 | 0.44 | 0.17 |
| 3–4 | 1,214 | 14.1 | 0.48 | 0.25 |
| 5–8 | 372 | 13.1 | 0.43 | 0.22 |
| 9–16 | 126 | 15.2 | 0.40 | 0.20 |
| 17–32 | 37 | 17.2 | 0.32 | 0.21 |
| 33+ | 17 | 34.0 | 0.08 | 0.05 |
| 1:1 OGs | 2,288 | 13.3 | 0.47 (pooled 0.51) | 0.21 (pooled 0.27) |
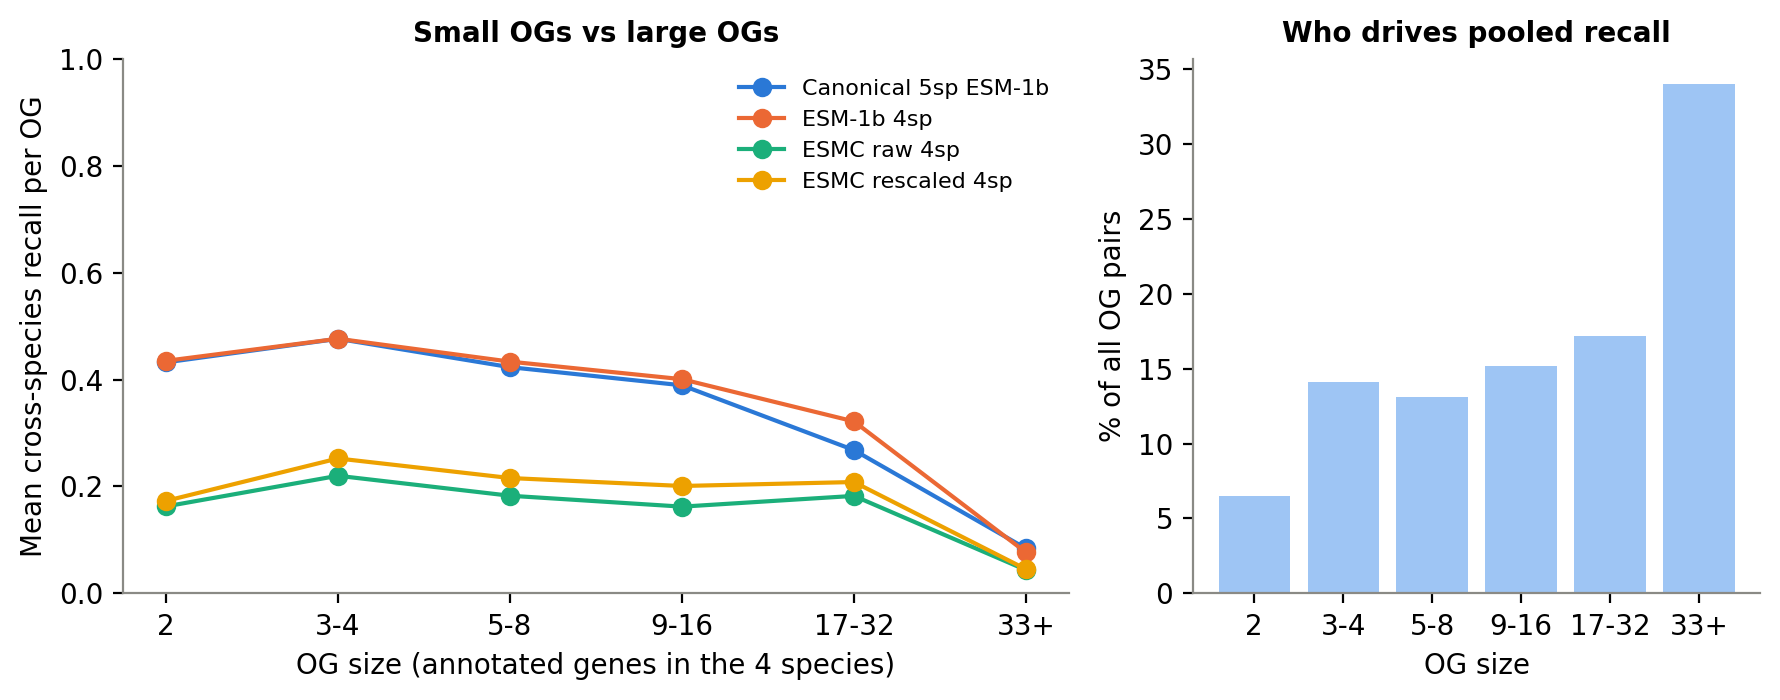
- 17 giant families (33+ genes) contribute a third of all ortholog pairs and are almost completely split (recall ~0.08). That is expected for large families with subfamilies, and it drags pooled recall down to 0.30.
- Small OGs fare better but are still kept together less than half the time; for clean 1:1 OGs, ~50% with ESM-1b vs ~25% with ESMC.
- The ESMC gap is not a big-family artifact: it is about 2× at every size (Figure 3).
The SATURN paper’s homology test
The SATURN paper did not measure ortholog recall. Its homology check (Fig. 2d) asks what share of macrogenes contain at least one BLASTP homolog pair between two species: 56% with the top-ranked gene per species and 91.2% with the top 10, vs 0.25% and 18.8% for random macrogenes (frog–zebrafish, 2,000 macrogenes, ESM-2 15B). Here the same question with all macrogene members (~10 genes, close to the top-10 version), homology = same eggNOG OG (strict) or ≥ 1 shared Pfam domain (permissive, closer to a BLASTP hit):
| % of macrogenes containing both species | ESM-1b 4sp: same OG | ESM-1b 4sp: shared Pfam | ESMC rescaled: same OG | ESMC rescaled: shared Pfam |
|---|---|---|---|---|
| Ciona–zebrafish | 52 | 75 | 38 | 56 |
| oyster–Ciona | 45 | 66 | 38 | 56 |
| oyster–zebrafish | 43 | 70 | 33 | 54 |
| Mnemiopsis–Ciona | 40 | 59 | 33 | 48 |
| Mnemiopsis–zebrafish | 40 | 63 | 29 | 43 |
| Mnemiopsis–oyster | 37 | 57 | 27 | 43 |
| Shuffled | ~0.2 | 2–7 | ~0.2 | 2–7 |
- The closest pair (Ciona–zebrafish) scores highest and every Mnemiopsis pair lowest: macrogenes follow the divergence gradient, as they should if they track homology.
- Our 57–75% is not directly comparable with the paper’s 91%: our species are far more divergent, our model is older and smaller, and shared Pfam is stricter than any BLASTP hit (compare the shuffled baselines).
- Our 0.30 recall is a much stricter test than anything in the SATURN paper; it does not mean our runs underperform the paper.
4. What K is, and our setup vs the SATURN paper
K is the number of macrogenes. SATURN (1) runs KMeans with K centres in protein-embedding space and gives each gene a weight to every macrogene (highest for the nearest); (2) adjusts the weights during pretraining; (3) freezes them for fine-tuning. K therefore sets how coarse the grouping is, before the embeddings matter:
| Small K (few, big macrogenes) | Large K (many, small macrogenes) | |
|---|---|---|
| Recall | up (100% at K = 1) | down: distant orthologs fall in different macrogenes |
| Precision | down: many OGs merged | up |
| Random baseline | high (~1/K) | low |
| Single-species macrogenes | fewer | more: a species-wide offset becomes larger than a macrogene |
K is chosen for cell integration, not to reproduce orthology: it is the number of shared features cells are compared on. The SATURN paper found label transfer barely changed across 1,000–3,000 macrogenes (frog–zebrafish, Extended Data Fig. 9).
| Paper: frog–zebrafish | Paper: mammal vignette | This project | |
|---|---|---|---|
| Species | 2 | 3 | 4 |
| Deepest split | ~430 My | ~90 My | ~600–700+ My (ctenophore vs bilaterians; date debated) |
| Protein model | ESM-2 15B (5,120 dims) | ESM-2 15B | ESM-1b 650M (1,280 dims) |
| HV genes per species | 8,000 | 6,000 | 8,000 |
| Total genes | ~16,000 | ~18,000 | ~32,000 |
| K | 2,000 (default) | 1,500 | 3,000 |
| Genes per macrogene | ~8 | ~12 | ~10.7 |
Our granularity is in the range the authors used. What differs is divergence time and the protein model: the paper’s main experiments used ESM-2 15B.
5. K sweep (05o, 05p)
Design: one variable at a time. SATURN’s exact KMeans call, KMeans(n_clusters=K, random_state=42) (scikit-learn 1.6.1, one initialization), at K = 500, 1,000, 2,000, 3,000, 5,000 and 10,000, on the identical 31,702 genes for both models. ESM-1b uses 03_embeddings; ESMC uses the rescaled vectors of the Oct 5 run. No other changes to the embeddings. Each K took ≤ 17 min on Pegasus.
Is KMeans a fair stand-in for SATURN’s macrogenes?
| ESM-1b | ESMC rescaled | |
|---|---|---|
| Genes keeping their macrogene from SATURN’s KMeans start to after pretraining | 97.6% (ARI 0.94) | 96.8% (ARI 0.93) |
| Refitting the same KMeans call vs SATURN’s original start | ARI 0.44 | ARI 0.33 |
| Recall at K = 3,000: refit vs SATURN run | 0.306 vs 0.302 | 0.173 vs 0.159 |
| Precision at K = 3,000: refit vs SATURN run | 0.142 vs 0.133 | 0.062 vs 0.057 |
- Yes. Pretraining moves only ~3% of genes, so macrogene membership is essentially the starting KMeans.
- But which macrogene a gene lands in is not reproducible run to run. The same call, seed and genes gave only ~40% agreement, most likely because KMeans with thousands of clusters is sensitive to tiny numerical differences (e.g. multithreaded summation order; possibly a different scikit-learn version in the original runs). An ARI of ~0.4 is also what separated the canonical 5-species and 4-species ESM-1b runs (Oct 6), so part of that “change” was probably run-to-run variation rather than dropping the urchin.
- Overall scores are stable (recall and precision within ~0.01–0.015), so they can be compared across runs; gene-by-gene macrogene identities (e.g. MG1089, MG2003) should not be compared across runs.
Results
| K | Recall ESM-1b / ESMC | Precision ESM-1b / ESMC | 1:1 OG recall ESM-1b / ESMC | % MGs with shared-Pfam pair ESM-1b / ESMC | % zebrafish genes in single-species MGs ESM-1b / ESMC |
|---|---|---|---|---|---|
| 500 | 0.39 / 0.20 | 0.025 / 0.014 | 0.42 / 0.25 | 76 / 66 | 5 / 26 |
| 1,000 | 0.37 / 0.19 | 0.051 / 0.025 | 0.46 / 0.24 | 72 / 60 | 14 / 29 |
| 2,000 | 0.33 / 0.18 | 0.095 / 0.046 | 0.51 / 0.27 | 67 / 53 | 23 / 45 |
| 3,000 | 0.31 / 0.17 | 0.142 / 0.062 | 0.52 / 0.28 | 65 / 51 | 31 / 50 |
| 5,000 | 0.26 / 0.15 | 0.210 / 0.089 | 0.54 / 0.30 | 62 / 49 | 43 / 60 |
| 10,000 | 0.20 / 0.12 | 0.342 / 0.154 | 0.52 / 0.31 | 64 / 49 | 64 / 75 |
- The curves never cross (Figure 4). ESMC’s best recall (0.20 at K = 500) equals ESM-1b’s worst (K = 10,000), where ESM-1b’s precision is 0.34 vs 0.01. Whatever K is chosen, ESM-1b recovers more orthologs with fewer wrong pairs; the same holds for 1:1 orthologs (~2×) and the Fig. 2d analogue (10–15 points).
- K behaves as expected: recall falls and precision rises with K; recall of 1:1 OGs peaks around K = 3,000–5,000 (ESM-1b 0.52–0.54); single-species macrogenes rise steeply (zebrafish, ESM-1b: 5% → 23% → 31% → 64% at K = 500 / 2,000 / 3,000 / 10,000).
- Macrogenes match OG granularity somewhere between K = 5,000 and 10,000: below that they mostly merge OGs, above it they mostly split them (Figure 5, bottom right).
- ESMC isolates zebrafish even with very coarse macrogenes: at K = 500 (~50 genes per macrogene), 26% of zebrafish genes are in zebrafish-only macrogenes with ESMC vs 5% with ESM-1b. The gap between zebrafish and the invertebrates in these ESMC vectors is wider than even a very large macrogene.
- K = 3,000 is a reasonable choice: near the 1:1-ortholog peak and at the paper’s granularity. K = 2,000 (SATURN’s default) would give somewhat higher recall and fewer zebrafish-only macrogenes (23% vs 31%) at lower precision.
6. A second orthology reference: OrthoFinder
eggNOG assigns each gene to precomputed OGs by its best database hit, so genes without a good hit get no OG. Coverage is uneven (Mnemiopsis 50%, zebrafish 99%), and the genes that drop out are the lineage-specific and fast-evolving ones. OrthoFinder (Emms & Kelly 2019) builds orthogroups de novo from our own four proteomes, so every gene can be placed. It is still sequence-based, so it shares eggNOG’s blind spot at deep divergence; the question is whether the conclusions above hold with both references. (Broccoli, Derelle et al. 2020, is a further option.)
Setup (06a–06c):
- One protein per gene (the longest), from the same proteome FASTAs and protein → gene bridges as the SATURN embeddings; stop characters removed. Mnemiopsis 15,545 genes; oyster 31,371; Ciona 18,788; zebrafish 25,400.
- Zebrafish: 6,029 proteins from unnamed genes on GRCz11 alternate-haplotype contigs (
ALT_CTG) dropped as duplicates of primary loci; 7,946 proteins from unnamed primary-assembly genes kept under their ENSDARG IDs (not SATURN genes, but part of the proteome). - OrthoFinder 3.1.0 (
-M msa -A mafft -T fasttree) with a fixed species tree(Mlei,(Cgig,(Crob,Drer))). With these four species the root is the same under ctenophore-first and sponge-first hypotheses, so the root (N0) hierarchical orthogroups would correspond to the Metazoa level. Run on Oct 15 (after rebuilding the environment; see that entry): 70 min on 16 cores. 05nand05ptake--reference of_og | of_hogand--eggnog_genes_only(to separate a different gene set from a different group definition).
Results (Oct 15).
OrthoFinder placed 83.3% of the 91,104 proteins in 12,254 orthogroups; 4,987 contain all four species and 2,577 of those are single-copy in each. Every SATURN gene was found in the tables (the gene bridges work). The share of SATURN genes in an orthogroup with at least one other species follows the divergence gradient: Mnemiopsis 43.9%, oyster 46.6%, Ciona 53.2%, zebrafish 78.0%. So even de novo, more than half of the Mnemiopsis genes have no sequence-detectable relative in the other three species, which caps any orthology-based score for that species.
No Metazoa-level hierarchical orthogroups. OrthoFinder 3.1 wrote HOGs only for N1 (oyster + Ciona + zebrafish) and N2 (Ciona + zebrafish), not for the root, the only level that includes Mnemiopsis. The same happened in a 3-species test, so it seems to skip the root node. of_hog is therefore not used here; the planned 6-species run (adding human and fly) will include a choanoflagellate outgroup so that the animal node is no longer the root. All results below use OrthoFinder orthogroups (of_og).
| Reference (genes scored) | Effective no. of groups | Macrogenes coarser by | Pair recall, ESM-1b / ESMC | 1:1 recall, ESM-1b / ESMC | Pairs from groups ≥ 33 genes | Genes in merged / cross-cutting OGs (ESM-1b) |
|---|---|---|---|---|---|---|
| eggNOG Metazoa OGs (21,674 annotated) | 7,155 | 3.4× | 0.30 / 0.15–0.16 | 0.51 / 0.24–0.27 | 34% | 28% / 63% |
| OrthoFinder, same genes (21,674) | 7,381 | 3.5× | 0.43 / 0.20–0.21 | 0.60 / 0.29–0.33 | 11% | 33% / 57% |
| OrthoFinder, all genes (31,692) | 9,754 | 4.5× | 0.39 / 0.17–0.18 | 0.59 / 0.28–0.32 | 19% | 29% / 63% |
- The model comparison does not depend on the reference. With OrthoFinder, ESM-1b again recovers about twice the ortholog pairs and 1:1 ortholog sets of either ESMC version, keeps at least twice as many small OGs whole, and scores 8–23 points higher on the Fig. 2d analogue (same-OG pairs) for every species pair.
- The K sweep gives the same picture. Against OrthoFinder, ESM-1b has higher recall and higher precision than ESMC at every K from 500 to 10,000 (e.g. K = 3,000: recall 0.38 vs 0.20, precision 0.069 vs 0.031, 1:1 recall 0.59 vs 0.33), with or without restricting to eggNOG-annotated genes. The curves never cross.
- Macrogenes are still ~3.5× coarser than orthogroups on the same genes, and the merge/cut-across pattern is unchanged.
- Recall is higher against OrthoFinder (0.30 → 0.43 on the same genes) mainly because of giant families: with eggNOG, 17 OGs of ≥ 33 genes supply 34% of all cross-species pairs and are almost never kept together; with OrthoFinder, groups that large supply only 11%. Clean 1:1 sets are also recovered more often (0.51 → 0.60), possibly because OrthoFinder’s tree-based 1:1 sets are truer orthologs.
- Precision drops when all genes are scored (ESM-1b, K = 3,000: 0.14 with eggNOG, 0.13 with OrthoFinder on the same genes, 0.07 on all genes). The ~10,000 genes without an eggNOG OG are mostly OrthoFinder singletons or single-species groups, so any cross-species macrogene partner they get counts as wrong. This is the lineage-specific gene set that sequence orthology cannot confirm either way: some of these pairings may be remote homologs, which only a structural comparison could tell.
Interpretation
- The ESMC vectors tested so far are pre-normalization hidden states, a sensible choice for FANTASIA’s cosine-based lookups but not like-for-like with SATURN’s ESM-1b vectors. The comparisons so far therefore test these ESMC vectors; a post-norm extraction is the fair test of ESMC itself.
- ESM-1b’s advantage over these vectors holds at every K, for clean 1:1 orthologs and on the SATURN paper’s own homology test, so it is not an artifact of K = 3,000, of big gene families, or of the recall metric.
- Macrogenes are coarser than orthogroups and cut across them. They are functional bins built for cell integration, not orthogroups; aggregate scores are reproducible, individual macrogene identities are not.
- On the paper’s homology test, ESM-1b macrogenes look reasonable for a 600+ million-year span, and follow the divergence gradient.
Caveats
- eggNOG is sequence-based and its coverage is uneven across species; OrthoFinder (section 6) checks robustness to the reference, but is also sequence-based. A structural comparison (Foldseek) would be orthogonal.
- The code check reflects the FANTASIA and
esmversions on PyPI now (FANTASIA 4.1 /protein_information_system3.1.2;esm3.4.1); the version Ingrid ran may differ in details. - One seed per K. Run-to-run variation in overall scores is ~0.01–0.015 (Table 10), small next to the model gap (~0.13 in recall), but seed replicates would give error bars for choosing K.
- Macrogene-level only. Cell-level integration across K and models was not compared.
- The Fig. 2d analogue uses hard assignments and all macrogene members, not the paper’s soft top-k weights, and Pfam/OG homology rather than BLASTP.
Possible next steps and troubleshooting
Considered, not pursued for now: removing the top principal components of ESM-1b. Protein embeddings share a few strong directions that nearly every protein points along: generic “this is a protein” signals related to things like length or amino-acid composition. These dominate distances, so unrelated proteins can look closer than they should. Removing the top 2–3 principal components (“all-but-the-top”; Mu & Viswanath 2018) is a standard fix for language-model embeddings, and on Oct 8 it raised ESM-1b’s nearest-neighbour ortholog rate from 53% to 61% (Mnemiopsis 51% → 58%), the largest gain of any fix. It is not used here because it changes the embeddings themselves, and this comparison changes one variable at a time (the protein model). Reasons for caution if revisited: it departs from the published SATURN pipeline; the removed directions may carry some biology (e.g. protein length, membrane vs soluble); they may partly be species offsets, so removing them acts as a partial species correction; and the components depend on the species set (adding coral species would require recomputing them). If revisited: include it as a third embedding set in the K sweep and adopt it only if it beats plain ESM-1b at every K.
Scripts
All in pipelines/scripts/saturn_embedding_comparison/.
| Script | Where | What it does |
|---|---|---|
05n_macrogene_vs_orthogroup_granularity.py |
Mac | OG vs macrogene counts, nesting, recall by OG size, Fig. 2d analogue; --reference |
05o_kmeans_sweep.py / .sh |
Pegasus | SATURN’s KMeans at each K for each model (13-job array incl. validation) |
05p_score_kmeans_sweep.py |
Mac | scores the sweep (recall, precision, 1:1 OGs, Fig. 2d analogue, single-species MGs); --reference |
06a_orthofinder_prep.py |
Pegasus | longest protein per gene, same gene bridges as SATURN; zebrafish ALT-contig handling |
06b_orthofinder_4sp.sh |
Pegasus | OrthoFinder 3.1.0 with a fixed species tree |
06c_orthofinder_to_reference.py |
Pegasus | OrthoFinder orthogroups / N0 HOGs → gene-level reference tables + coverage check |
References
- Rives A. et al. (2021) Biological structure and function emerge from scaling unsupervised learning to 250 million protein sequences. PNAS 118:e2016239118.
- Lin Z. et al. (2023) Evolutionary-scale prediction of atomic-level protein structure with a language model. Science 379:1123–1130. https://doi.org/10.1126/science.ade2574
- Hayes T. et al. (2025) Simulating 500 million years of evolution with a language model. Science 387:850–858. https://doi.org/10.1126/science.ads0018
- ESM Team / EvolutionaryScale (2024) ESM Cambrian. https://www.evolutionaryscale.ai/blog/esm-cambrian; code: https://github.com/evolutionaryscale/esm
- Rosen Y. et al. (2024) Toward universal cell embeddings: integrating single-cell RNA-seq datasets across species with SATURN. Nature Methods 21:1492–1500. https://doi.org/10.1038/s41592-024-02191-z
- Barrios-Núñez I., Martínez-Redondo G.I. et al. (2024) Decoding functional proteome information in model organisms using protein language models. NAR Genomics and Bioinformatics 6:lqae078. https://doi.org/10.1093/nargab/lqae078; FANTASIA: https://github.com/CBBIO/FANTASIA, https://fantasia.readthedocs.io
- Hallee L., Peleg T., Rafailidis N., Gleghorn J.P. (2025) Protein language models are accidental taxonomists. bioRxiv https://doi.org/10.1101/2025.10.07.681002
- Ding F., Steinhardt J. (2024) Protein language models are biased by unequal sequence sampling across the tree of life. bioRxiv https://doi.org/10.1101/2024.03.07.584001
- Vieira L.C., Handojo M.L., Wilke C.O. (2025) Medium-sized protein language models perform well at transfer learning on realistic datasets. Scientific Reports 15:21400. https://doi.org/10.1038/s41598-025-05674-x
- Sun M., Chen X., Kolter J.Z., Liu Z. (2024) Massive activations in large language models. COLM 2024. https://arxiv.org/abs/2402.17762
- Ba J.L., Kiros J.R., Hinton G.E. (2016) Layer normalization. https://arxiv.org/abs/1607.06450
- Mu J., Viswanath P. (2018) All-but-the-top: simple and effective postprocessing for word representations. ICLR 2018. https://arxiv.org/abs/1702.01417
- Timkey W., van Schijndel M. (2021) All bark and no bite: rogue dimensions in transformer language models obscure representational quality. EMNLP 2021. https://aclanthology.org/2021.emnlp-main.372
- Schütze K., Heinzinger M., Steinegger M., Rost B. (2022) Nearest neighbor search on embeddings rapidly identifies distant protein relations. Frontiers in Bioinformatics 2:1033775. https://doi.org/10.3389/fbinf.2022.1033775
- Kaminski K. et al. (2023) pLM-BLAST: distant homology detection based on direct comparison of sequence representations from protein language models. Bioinformatics 39:btad579. https://doi.org/10.1093/bioinformatics/btad579
- Pantolini L. et al. (2024) Embedding-based alignment: combining protein language models with dynamic programming alignment to detect structural similarities in the twilight-zone. Bioinformatics 40:btad786. https://doi.org/10.1093/bioinformatics/btad786
- PLM-OMG: protein language model-based ortholog detection for cross-species cell type mapping (2025). bioRxiv https://doi.org/10.1101/2025.05.30.657127
- Protein large language model assisted one-to-one gene homology mapping in cross-species single-cell transcriptome integration (2025). bioRxiv https://doi.org/10.1101/2025.10.17.683009
- Huerta-Cepas J. et al. (2019) eggNOG 5.0: a hierarchical, functionally and phylogenetically annotated orthology resource. Nucleic Acids Research 47:D309–D314. https://doi.org/10.1093/nar/gky1085
- Cantalapiedra C.P. et al. (2021) eggNOG-mapper v2. Molecular Biology and Evolution 38:5825–5829.
- Mistry J. et al. (2021) Pfam: the protein families database in 2021. Nucleic Acids Research 49:D412–D419. https://doi.org/10.1093/nar/gkaa913
- Emms D.M., Kelly S. (2019) OrthoFinder: phylogenetic orthology inference for comparative genomics. Genome Biology 20:238. https://doi.org/10.1186/s13059-019-1832-y
- Derelle R., Philippe H., Colbourne J.K. (2020) Broccoli: combining phylogenetic and network analyses for orthology assignment. Molecular Biology and Evolution 37:3389–3396. https://doi.org/10.1093/molbev/msaa159
- Lloyd S. (1982) Least squares quantization in PCM. IEEE Transactions on Information Theory 28:129–137.
- Pedregosa F. et al. (2011) Scikit-learn: machine learning in Python. Journal of Machine Learning Research 12:2825–2830.
- Rosenberg A., Hirschberg J. (2007) V-measure: a conditional entropy-based external cluster evaluation measure. EMNLP-CoNLL 2007.
- Hubert L., Arabie P. (1985) Comparing partitions. Journal of Classification 2:193–218.