A new orthology reference covers all six SATURN species:
Mnemiopsis, oyster, fly, Ciona, zebrafish, human;
plus the choanoflagellate Salpingoeca rosetta as an outgroup, to root the tree.
The outgroup fixed the missing Metazoa level. The 4-species run of Oct 15 wrote no root-level hierarchical orthogroups. Here the root is Choanozoa and node N1 = Metazoa, so the Metazoa-level groups exist (N1.tsv).
137,235 genes (one protein per gene), 85.6% in 13,282 orthogroups:
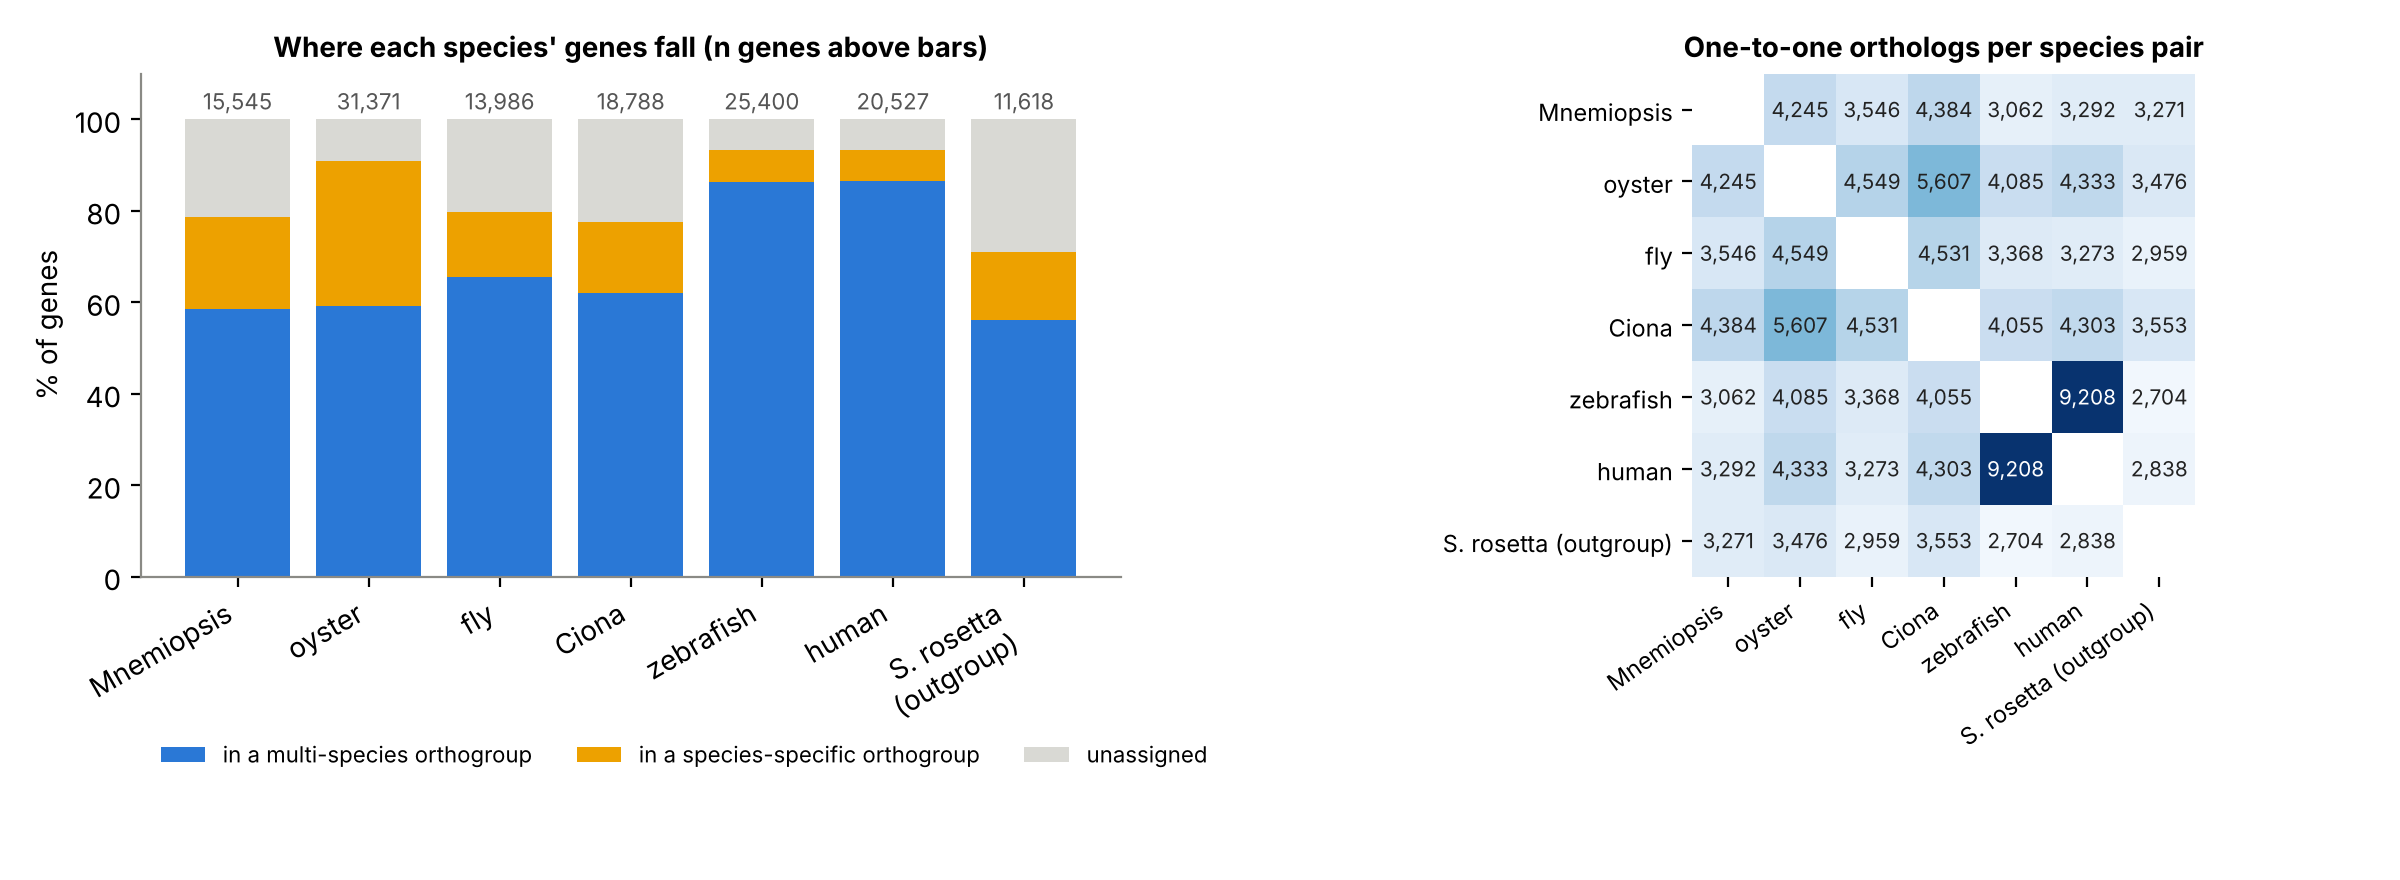
Gene placement follows divergence and genome history (Figure 1):
human and zebrafish have 93% of genes in orthogroups;
Mnemiopsis, fly and Ciona 78–80%;
oyster has 31.5% of its genes in oyster-only orthogroups, the most of any species. Its branch carries 16,601 gene duplications.
One-to-one orthologs: human–zebrafish 9,208 pairs; Mnemiopsis pairs 3,062–4,384. Oyster–Ciona (5,607) has more than Ciona–zebrafish (4,055), because zebrafish genes are often duplicated.
Two gene-level reference tables for the SATURN benchmarks:
orthogroups: 29,292 groups;
Metazoa-level groups: 30,275 groups.
Key terms
Table 1: Terms used in this entry.
Term
Meaning here
Orthogroup (OG)
All genes descended from one gene in the last common ancestor of the species analysed (orthologs plus in-paralogs).
Hierarchical orthogroup (HOG)
An orthogroup defined at one node of the species tree using gene trees. A HOG at the Metazoa node holds the genes descended from one gene in the last common ancestor of animals. Duplications older than that node split groups.
Outgroup
A species outside the group of interest, used to root the tree. Here S. rosetta, a choanoflagellate (the closest living relatives of animals).
Species-specific orthogroup
An orthogroup containing genes from only one species, typically a lineage-specific family or expansion.
Unassigned gene
A gene placed in no orthogroup: no detectable relative among the other proteomes.
One-to-one orthologs
A gene pair where each species has exactly one copy descended from the ancestral gene.
Gene duplication (per node)
A duplication event OrthoFinder places on a branch of the species tree from the gene trees.
1. Why a new run
Fly and human are new. The eggNOG annotation tables and the Oct 15 OrthoFinder run cover only the original four species.
Metazoa-level HOGs were missing.
The Oct 15 run used a fixed tree with Mnemiopsis at the base, so the Metazoa node was the root.
OrthoFinder 3.1 wrote no N0.tsv (root-level HOGs). That left only orthogroups, which can lump paralogs from very old duplications.
Adding a non-animal outgroup puts the Metazoa node one step below the root.
S. rosetta has a well-annotated RefSeq proteome (~11.6k genes) and is a standard choanoflagellate outgroup.
2. Inputs
One protein per gene: the longest. Gene IDs use the same protein-to-gene bridges as the SATURN embeddings (06a). Internal stop codons are replaced by X.
Table 2: OrthoFinder input (one longest protein per gene).
Species
Proteome
Genes
Notes
Mnemiopsis leidyi
genome-v3 gene models
15,545
as on Oct 15
Crassostrea gigas (oyster)
NCBI RefSeq
31,371
as on Oct 15
Ciona robusta
Ghost KY21
18,788
as on Oct 15
Danio rerio (zebrafish)
Ensembl 113 GRCz11
25,400
as on Oct 15 (unnamed alternate-haplotype copies dropped)
Drosophila melanogaster (fly)
Ensembl 113 BDGP6.46
13,986
Homo sapiens (human)
Ensembl 113 GRCh38
20,527
primary assembly only: 11,512 proteins (3,337 genes) on alternate-haplotype (HSCHR*) and patch (HG*) scaffolds dropped; 98% duplicate a primary-assembly gene and would otherwise look like paralogs. Unplaced primary scaffolds (KI*, GL*) kept
Salpingoeca rosetta (outgroup)
NCBI RefSeq GCF_000188695.1
11,618
11,725 proteins, all linked to a gene via GFF locus_tag
Total
137,235
3. The run
Command: OrthoFinder 3.1.0, -M msa -A mafft -T fasttree -t 16 -a 16.
Species tree:(Sros,(Mlei,((Cgig,Dmel),(Crob,(Drer,Hsap))))), fixed with -s.
It assumes ctenophores branch first among animals. With a single ctenophore and no sponge, the sponge-first hypothesis gives the same Metazoa node.
not written (OrthoFinder 3.1 does not output the root)
N1
Metazoa
6 SATURN species
N1.tsv
N2
Bilateria
oyster, fly, Ciona, zebrafish, human
N2.tsv
N3
Protostomia
oyster, fly
N3.tsv
N4
Deuterostomia
Ciona, zebrafish, human
N4.tsv
N5
Vertebrata
zebrafish, human
N5.tsv
4. Results
4.1 Overall
Table 4: OrthoFinder summary statistics.
Statistic
6 species + outgroup (this run)
4 species (Oct 15)
Genes
137,235
91,104
Genes in orthogroups
117,535 (85.6%)
75,861 (83.3%)
Unassigned genes
19,700 (14.4%)
15,243 (16.7%)
Orthogroups
13,282 (mean 8.8, median 6 genes)
12,254 (mean 6.2, median 4)
Species-specific orthogroups
3,543, holding 22,876 genes (16.7%)
3,561, holding 22,576 genes (24.8%)
Orthogroups with all species
3,255
4,987
… single-copy in every species
1,260
2,577
G50 / O50 (assigned genes)
11 genes / 2,085 orthogroups
5 genes / 3,263 orthogroups
Orthogroups present in all species and single-copy orthogroups both fall with more species. Each extra species is another chance for a family to be lost or duplicated.
Table 5: Orthogroups by number of species.
Species in the orthogroup
1
2
3
4
5
6
7
Orthogroups
3,543
1,814
792
878
1,220
1,780
3,255
4.2 Per species
Table 6: Per-species statistics (genes = one protein per gene).
Mnemiopsis
oyster
fly
Ciona
zebrafish
human
S. rosetta
Genes
15,545
31,371
13,986
18,788
25,400
20,527
11,618
% in orthogroups
78.5
90.8
79.8
77.6
93.3
93.3
71.0
% in species-specific orthogroups
20.1
31.5
14.2
15.6
7.1
6.9
14.9
% unassigned
21.5
9.2
20.2
22.4
6.7
6.7
29.0
Orthogroups containing the species
6,308
9,156
6,194
7,468
9,014
8,951
5,533
Duplications on its own branch
4,681
16,601
3,625
5,106
8,537
4,425
2,400
Figure 1: Left: share of each species’ genes in multi-species orthogroups, species-specific orthogroups, or unassigned. Right: one-to-one ortholog pairs between each pair of species.
Vertebrates are the best connected: 86% of human and zebrafish genes are in multi-species orthogroups. That reflects their gene content and their mutual closeness: the panel has two vertebrates and one of each other lineage.
Mnemiopsis, fly and Ciona have about a fifth of their genes unassigned. For Mnemiopsis this caps any orthology-based score: genes without a detectable relative cannot be judged right or wrong by an orthology reference.
Oyster stands out. 31.5% of its genes are in oyster-only orthogroups, and its branch carries more duplications (16,601) than any other. That fits the known lineage-specific gene family expansions in oysters.
Zebrafish has the second-highest branch duplication count (8,537), consistent with the teleost genome duplication.
4.3 One-to-one orthologs
Table 7: One-to-one ortholog pairs between the six SATURN species.
Mnemiopsis
oyster
fly
Ciona
zebrafish
human
Mnemiopsis
4,245
3,546
4,384
3,062
3,292
oyster
4,549
5,607
4,085
4,333
fly
4,531
3,368
3,273
Ciona
4,055
4,303
zebrafish
9,208
Human–zebrafish is by far the richest pair (9,208), which makes it the natural positive control for cross-species cell matching.
Every Mnemiopsis pair has 3,000–4,400 one-to-one orthologs: fewest with the vertebrates, most with Ciona and oyster.
Oyster–Ciona (5,607) exceeds Ciona–zebrafish (4,055), although Ciona and zebrafish are the closer relatives. Duplications on the zebrafish lineage turn many one-to-one relationships into one-to-many; the same was seen with four species on Oct 15.
4.4 Duplications on internal branches
Table 8: Gene duplications placed on internal branches of the species tree.
Node
Duplications (all)
Duplications (≥50% support)
N1 Metazoa
1,047
591
N2 Bilateria
1,340
680
N3 Protostomia
93
93
N4 Deuterostomia
200
171
N5 Vertebrata
4,251
4,251
The vertebrate stem carries most internal-branch duplications, as expected from the two vertebrate whole-genome duplications. Only 591 well-supported duplications sit at the Metazoa node, so most Metazoa-level HOGs match their orthogroup.
4.5 Reference tables for the SATURN benchmarks
06c turns the output into gene-level tables (species, gene, protein, group) with the outgroup removed. It finds the Metazoa node automatically from the species tree: the node whose descendants are exactly the six species.
The HOG table splits orthogroups at duplications older than Metazoa, so it is the stricter reference: fewer groups span all six species. Both will be used to score the 6-species SATURN macrogene runs.
Caveats
Fixed species tree, ctenophores first. HOG levels depend on it. With one ctenophore and no sponge the Metazoa node is the same under either hypothesis.
Annotation quality differs between species.Mnemiopsis and Ciona gene models are less complete than human or fly, which raises their unassigned share. Gene-model completeness (e.g. BUSCO) would make the comparison fairer.
One protein per gene (longest). Other isoforms can carry different domains; this matches standard OrthoFinder practice.
Peak memory (41.5 GB) exceeded the 32 GB requested. It fitted only because the node had 62.8 GB. Request ≥48 GB for runs this size.
gene-level OG and Metazoa-HOG tables; outgroup removed; Metazoa node from the species tree
cd /scratch/dark_genes/SATURN_Mnemibsub< scripts/06a0_download_outgroup.shpython3 scripts/06a_orthofinder_prep.py --species Mlei,Cgig,Crob,Drer,Dmel,Hsap,Sros --out_dir 06_orthofinder_6spbsub-q parallel < scripts/06b6_orthofinder_6sp.sh # job 603391 (moved from normal with bmod)python scripts/06c_orthofinder_to_reference.py --of_dir 06_orthofinder_6sp --saturn_run""
References
Emms D.M., Kelly S. (2019) OrthoFinder: phylogenetic orthology inference for comparative genomics. Genome Biology 20:238.
Emms D.M., Liu Y., Belcher L., Holmes J., Kelly S. (2025) OrthoFinder 3 (bioRxiv; as cited by OrthoFinder 3.1.0).
Emms D.M., Kelly S. (2017) STRIDE: species tree root inference from gene duplication events. Molecular Biology and Evolution 34:3267–3278.
Fairclough S.R. et al. (2013) Premetazoan genome evolution and the regulation of cell differentiation in the choanoflagellate Salpingoeca rosetta. Genome Biology 14:R15.
Zhang G. et al. (2012) The oyster genome reveals stress adaptation and complexity of shell formation. Nature 490:49–54.