Design: four six-species SATURN runs in a 2×2: gene embeddings from ESM-1b or ESMC-600M post-norm, each built from all isoforms averaged or the longest isoform per gene. Here I compare their macrogenes. The integration (cell-level) comparison comes later.
The embedding model changes the macrogenes far more than the isoform rule does.
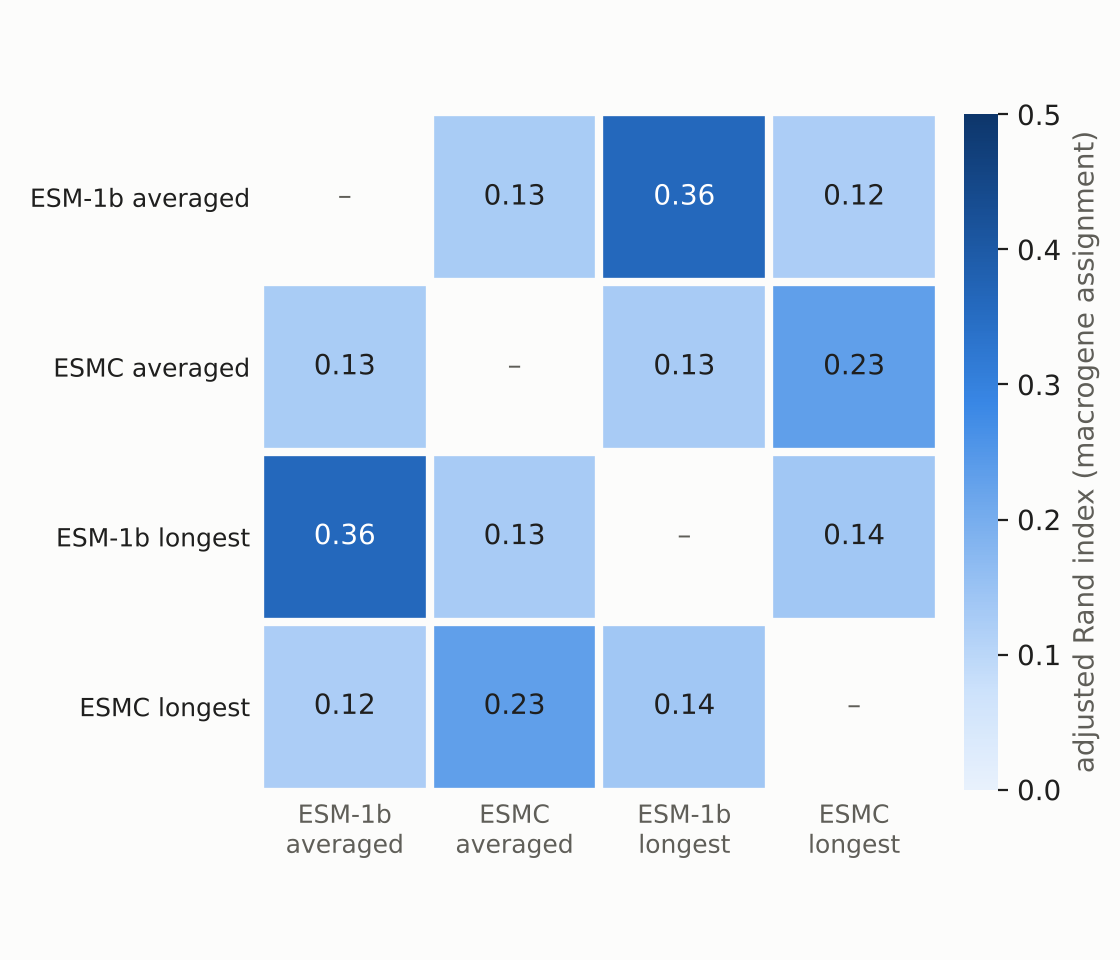
Agreement between runs (adjusted Rand index): 0.12–0.14 when the model changes, vs 0.36 (ESM-1b) and 0.23 (ESMC) when only the isoform rule changes (Figure 1).
Most of the isoform-rule difference is k-means noise. Rerunning SATURN’s identical k-means call on identical inputs gives only ARI 0.44 (ESM-1b) and 0.33 (ESMC) (Oct 9). The isoform runs sit just below that; the model runs sit far below it.
ESM-1b has ~3× the ortholog recall of ESMC under both isoform rules: 0.27–0.28 vs 0.09–0.10 (Table 4). The isoform rule does not close the gap (interaction ≈ 0).
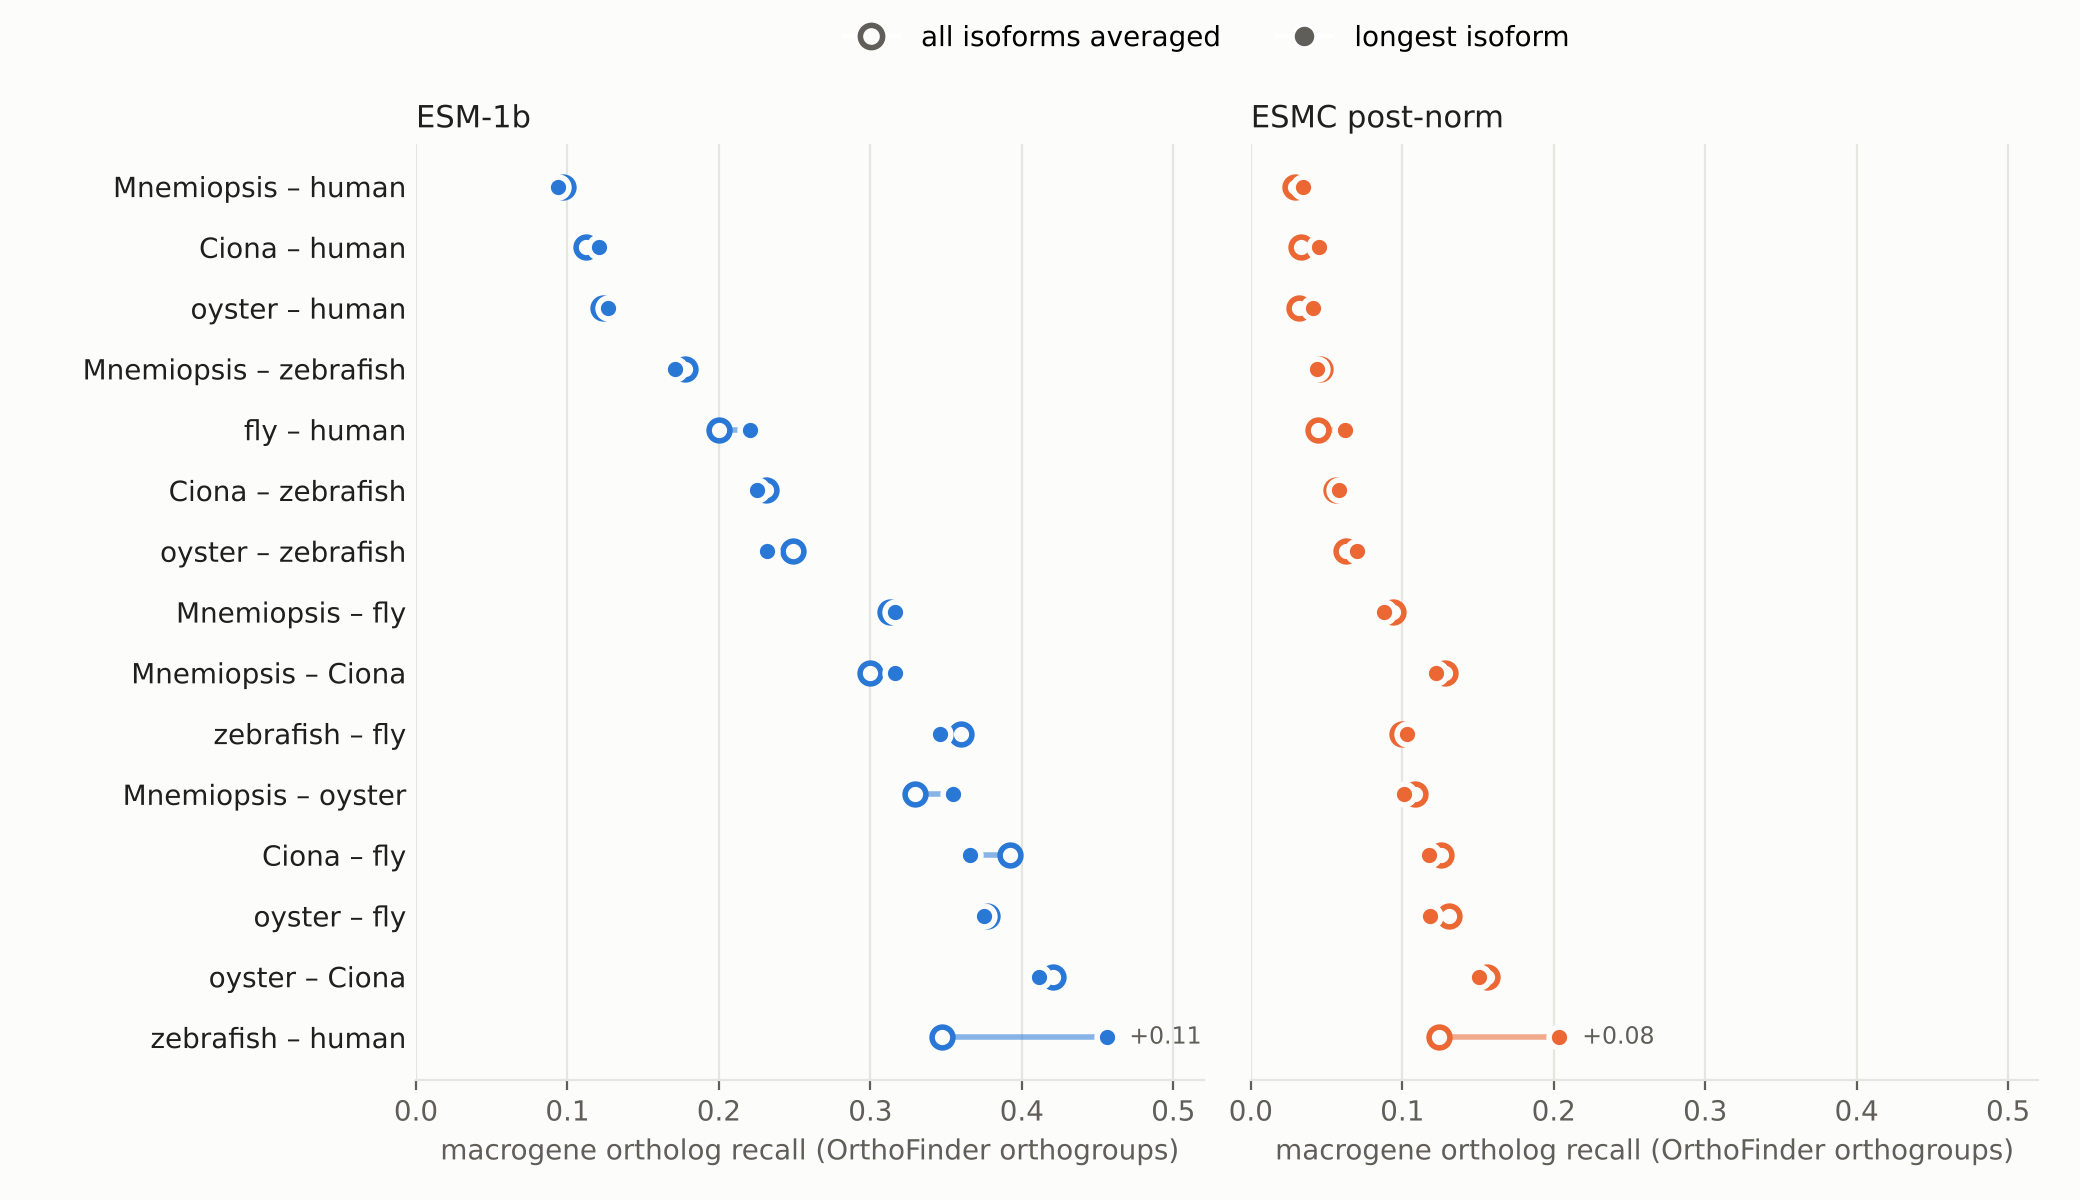
The longest isoform helps one pair a lot and the rest hardly at all (Figure 2).
Zebrafish–human recall: ESM-1b 0.35 → 0.46, ESMC 0.12 → 0.20. With ESM-1b, precision also rises (0.12 → 0.19) while fewer gene pairs are placed together, so these macrogenes got tighter and more correct.
Pooled over all pairs: +0.01 recall for both models, inside what other pairs move up or down.
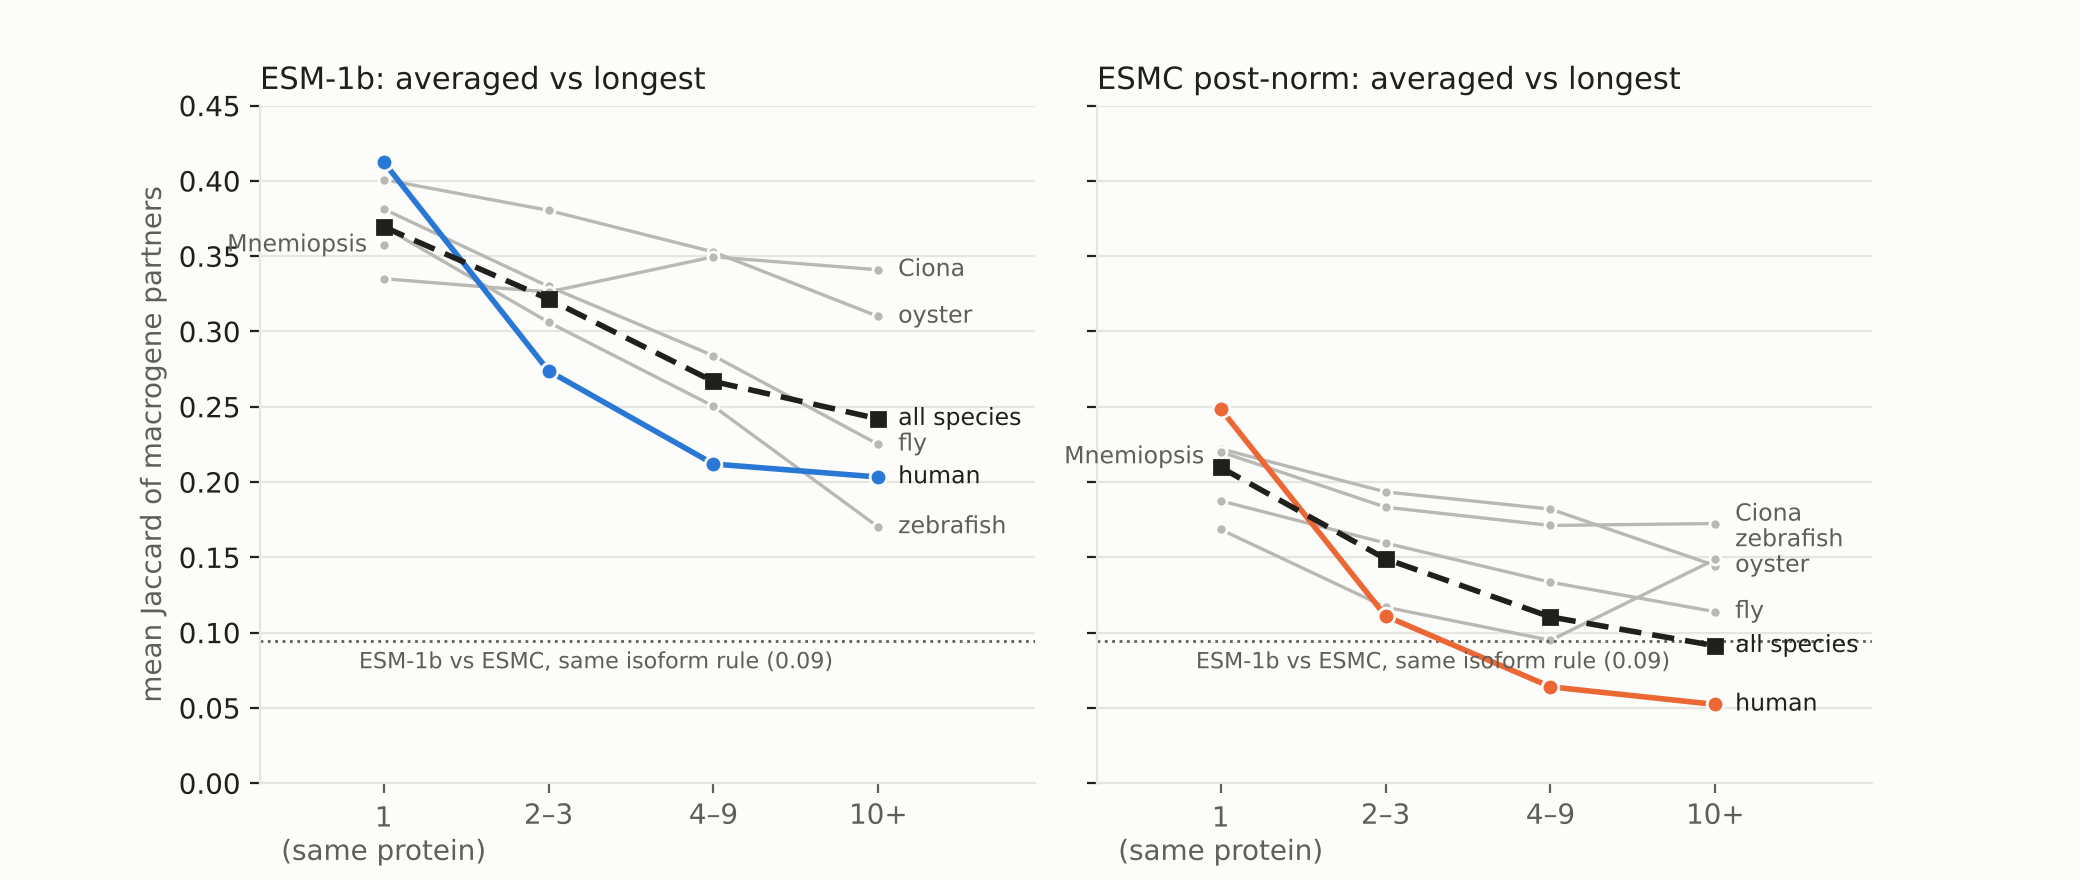
Genes with more isoforms change macrogene partners more (Figure 3), and the more a gene’s vector changed, the more its partners changed (Table 6). So the change is driven by the isoform rule, not only by run-to-run variation.
Macrogene membership is not reproducible gene by gene, even for genes whose protein didn’t change (they keep ~37% of their partners with ESM-1b, ~21% with ESMC). Macrogenes are essentially one run of k-means on the embeddings, and k-means with 3,000 clusters lands on a different solution after tiny changes (section 1.1). Aggregate scores are stable (±0.01–0.015), so they, not individual macrogenes, are what to compare.
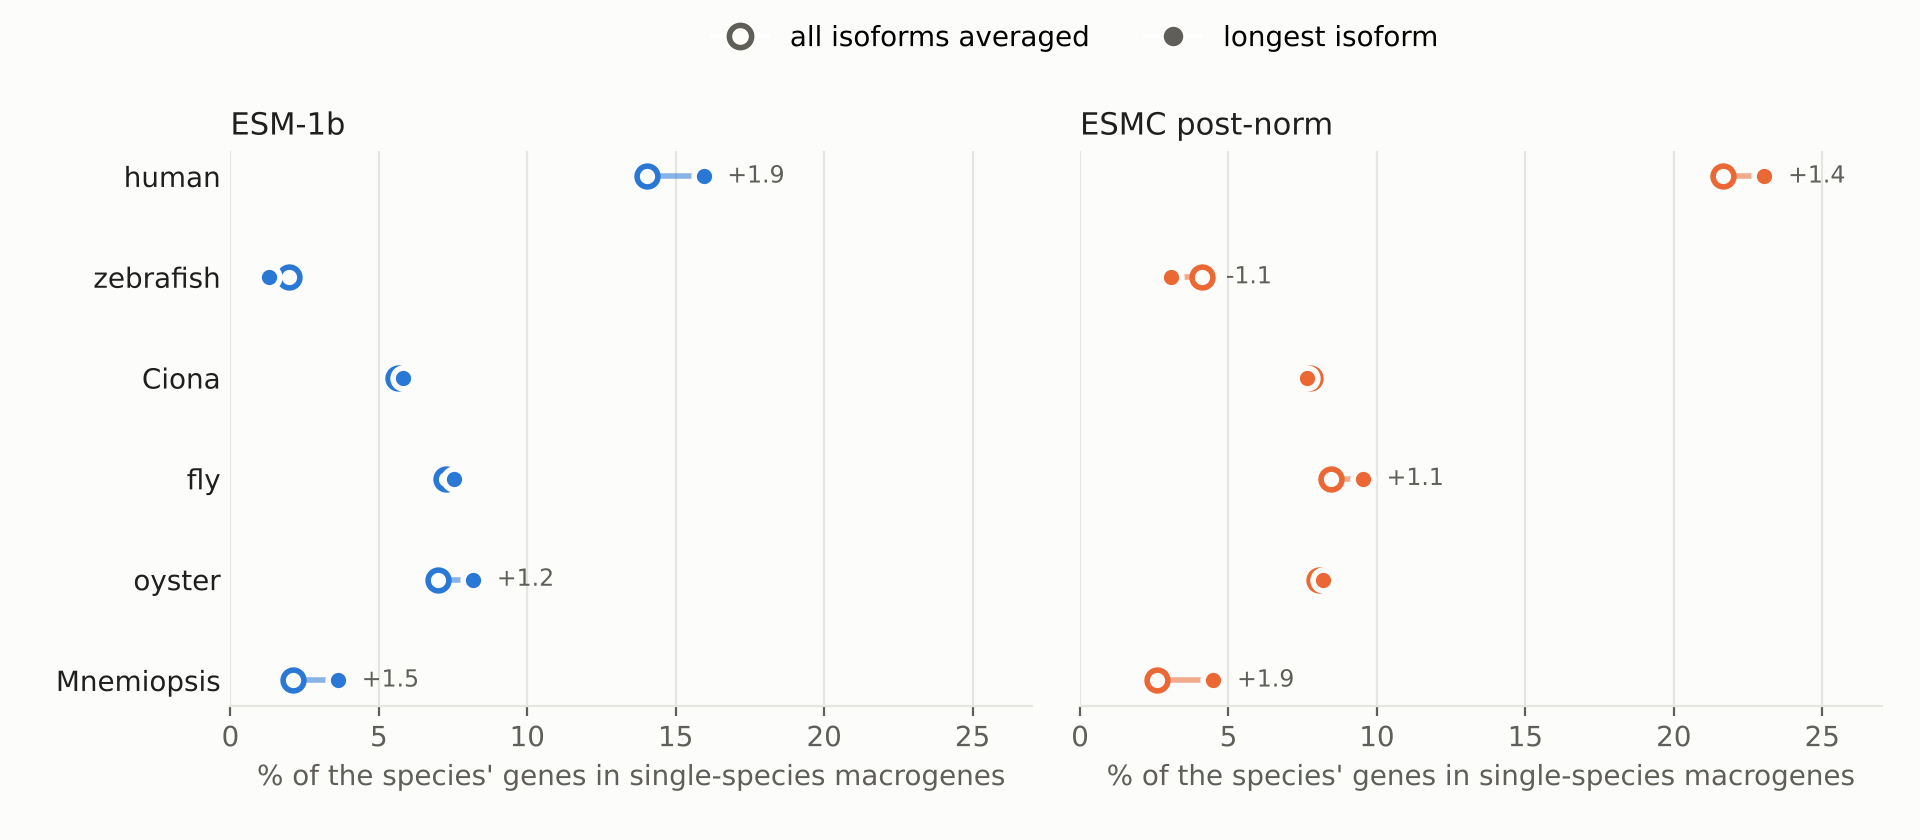
Human genes did not move out of human-only macrogenes (Figure 4). The share went up slightly (ESM-1b 14.0 → 15.9%), but the ctenophore, whose vectors are identical under both rules, went up just as much. That size of change is within run-to-run variation.
Preliminary: the “averaged” runs are the Oct 27 macrogene-only runs. For ESMC this uses the older, unmatched gene files. Matched full runs and a seed replicate finish around Nov 2–3, and this comparison will be rerun then.
This entry follows Oct 27, which found that the longest isoform improves human ortholog matching at the embedding level, for both models. Here I check whether that carries into SATURN’s macrogenes, and how the isoform effect compares with the model effect. Terms (macrogene, recall, precision, orthogroup, Metazoa-level group) are defined in the Oct 27 entry.
1. Design
Table 1: The four conditions in this entry.
All isoforms averaged
Longest isoform (same protein for both models)
ESM-1b
10-19 macrogene-only run (job 603398). Full run with identical inputs: job 622420, running
full run, job 614411 (done Oct 30)
ESMC-600M post-norm
10-19 macrogene-only run (603399), older ESMC files (see below). Matched full run: job 622421, running
full run, job 614412 (done Oct 30)
Everything else is the same in all four: six species, the same cells and labels, 3,000 macrogenes, 8,000 highly variable (HV) genes per species, seed 42, 200 pretraining epochs, CPU.
Macrogene-only and full runs are comparable here. Macrogene membership is fixed at the end of pretraining; SATURN writes the gene–macrogene weights at that point, before metric learning. Each gene is assigned to its highest-weight macrogene.
Gene sets. The longest-isoform runs, and the new averaged full runs, use identical genes for both models in all six species, and therefore identical HV genes (checked Oct 29: identical in all 6 species). The older averaged ESMC files cover more zebrafish genes, so 7,808 of 8,000 zebrafish HV genes are shared. All comparisons below use the 47,808 genes common to all four runs.
The new averaged ESMC files average exactly the isoforms ESM-1b averaged, gene by gene, and keep only ESM-1b’s genes. Without this, the ESMC averaged condition would differ from ESM-1b in gene set and isoform set as well as model.
1.1 How macrogenes are made, and why they vary
From the code check of train-saturn.py (Oct 6, Oct 9):
All HV genes of all species are stacked as raw protein vectors (no normalization).
KMeans(n_clusters=3000, random_state=42) is run once, with Euclidean distance.
Each gene’s starting weight for every macrogene comes from the rank of its distance to that centroid (log1p(1/rank)^2 * 2): almost all weight goes to the nearest few.
Pretraining learns to reconstruct each species’ expression from macrogene expression (expression × weights). A rank loss keeps the weights consistent with the embeddings’ cosine similarities.
Here each gene is assigned to its top-weight macrogene.
Pretraining hardly changes membership: 97% of genes keep their k-means macrogene (ARI 0.94; Oct 9). So a macrogene is, in practice, a k-means cluster of protein vectors.
This explains two things.
Why macrogenes behave differently from the most-similar-gene test. That test asks, one gene at a time, whether a gene’s closest match (cosine) in another species is its ortholog. A macrogene instead depends on where k-means draws boundaries through all 48,000 vectors at once, using Euclidean distance (which also counts vector length and the shared direction all ESM-1b vectors have). Two genes that are each other’s best match can still be split by a boundary. With ~16 genes per macrogene, most partners are not orthologs (precision ≤ ~0.1), and large families spread over several macrogenes. ESMC’s ~3 effective dimensions make k-means cut along a few axes, some of them species axes. That is why ESMC has more single-species macrogenes and its 2× gap in the most-similar-gene test becomes 3× in macrogene recall.
Why macrogenes vary between runs. The vectors form a continuous cloud, not 3,000 separate clumps, so many partitions are almost equally good. Which one k-means finds depends on tiny numerical differences (multithreaded summation order, library version). Every centroid depends on every gene, so any input change gives a different solution overall. On Oct 9, refitting the identical call (same genes, same seed) agreed with SATURN’s own macrogenes at only ARI 0.44 (ESM-1b) and 0.33 (ESMC), while recall and precision moved by only 0.01–0.015. ESMC is less reproducible because its genes are less clearly closest to one centroid (lower weight margins).
These noise figures come from the four-species runs. The averaged ESM-1b full run (622420) has the same inputs and seed as the 10-19 run, so it will give the six-species value directly.
2. The model matters more than the isoform rule
Figure 1: Agreement of macrogene assignments between the four runs (adjusted Rand index over the 47,808 common genes; 1 = identical, 0 = chance).
Table 2: How much the macrogenes change. Partner Jaccard: for each gene, the overlap between the other genes in its macrogene in run A and in run B (1 = same partners), averaged over genes.
What changes between the two runs
ESM-1b
ESMC post-norm
isoform rule only (same model)
ARI 0.36; mean partner Jaccard 0.34
ARI 0.23; Jaccard 0.17
model only (same isoform rule)
ARI 0.13 (averaged), 0.14 (longest); Jaccard 0.09–0.10
same
nothing (same k-means call refitted; Oct 9, four species)
ARI 0.44
ARI 0.33
Switching the model replaces almost all macrogene partners (Jaccard ≈ 0.1, ARI 0.12–0.14), far beyond k-means noise.
Switching the isoform rule changes macrogenes only slightly more than refitting k-means with no change at all (ARI 0.36 vs 0.44 for ESM-1b; 0.23 vs 0.33 for ESMC). Most of the difference between the averaged and longest runs is therefore k-means noise, not the isoform rule.
ESMC macrogenes are less stable than ESM-1b’s under any change, including no change. This fits ESMC’s weaker gene–macrogene assignments: median top weight 0.63 vs 0.70, margin 0.36 vs 0.44, unchanged by the isoform rule.
Per species, the isoform rule changes human macrogenes most (ESM-1b ARI: human 0.23, oyster 0.53, Mnemiopsis 0.47). Human has the most isoforms per gene.
The real isoform signal is in which genes moved, not how many (section 4).
Table 3: Macrogene composition (each run’s own 48,000 HV genes).
ESM-1b averaged
ESM-1b longest
ESMC averaged
ESMC longest
Macrogenes with one species
262
271
533
566
Macrogenes with all six species
325
310
265
242
Median genes per macrogene
12
12
14
14
Median weight of a gene’s top macrogene
0.70
0.70
0.63
0.63
3. Ortholog benchmark
Table 4: Pooled ortholog benchmark against six-species OrthoFinder orthogroups (Metazoa-level groups in brackets). Random expectation < 0.001 for every condition.
ESM-1b averaged
ESM-1b longest
ESMC averaged
ESMC longest
Recall, all pairs
0.266 (0.309)
0.279 (0.324)
0.085 (0.098)
0.096 (0.111)
Precision, all pairs
0.106 (0.090)
0.107 (0.090)
0.039 (0.032)
0.041 (0.035)
OG recovery
0.52
0.54
0.21
0.24
Recall, Mnemiopsis pairs
0.239
0.247
0.081
0.078
Recall, invertebrate pairs
0.344
0.353
0.113
0.104
Recall, zebrafish–human
0.347 (0.368)
0.456 (0.482)
0.124 (0.135)
0.204 (0.223)
Precision, zebrafish–human
0.124 (0.113)
0.190 (0.174)
0.051 (0.048)
0.073 (0.069)
Zebrafish–human pairs placed together
44,380
37,882
38,770
44,335
Cross-species gene pairs placed together
336,337
350,656
295,862
310,310
Table 5: Effects. Isoform effect = longest − averaged, within a model. Model effect = ESMC − ESM-1b, within an isoform rule. Interaction = isoform effect for ESMC − isoform effect for ESM-1b.
Pooled over all 15 pairs (orthogroups)
Isoform effect, ESM-1b
Isoform effect, ESMC
Model effect, averaged
Model effect, longest
Interaction
recall
+0.013
+0.011
−0.181
−0.183
−0.002
precision
+0.001
+0.003
−0.068
−0.065
+0.002
OG recovery
+0.021
+0.022
−0.309
−0.308
+0.001
Figure 2: Macrogene ortholog recall per species pair, all isoforms averaged (open) vs longest isoform (filled). Labels mark changes of 0.05 or more.
The model effect is ~15× the isoform effect, and the two don’t interact: the longest isoform helps both models by the same small amount.
Zebrafish–human is the only pair that clearly gains (+0.11 ESM-1b, +0.08 ESMC). This is the pair that gained most at the embedding level (hit@1 0.67 → 0.82, Oct 27). With ESM-1b it is now clearly the best pair, as a positive control should be.
With ESM-1b, the zebrafish–human gain is a real improvement, not just more grouping: fewer zebrafish–human gene pairs are placed together (44,380 → 37,882), yet more of them are orthologs (precision 0.12 → 0.19). With ESMC, more pairs are placed together (38,770 → 44,335), so its recall gain is partly from more grouping.
Other pairs move by ±0.03 in both directions (e.g. Ciona–fly −0.027, Mnemiopsis–oyster +0.025 with ESM-1b), with no pattern by species. This is likely run-to-run variation; the seed replicate will show its size.
Human paired with oyster, Ciona or Mnemiopsis is still weak (recall 0.09–0.13 with ESM-1b) and unchanged by the isoform rule, as at the embedding level.
4. Which genes changed macrogene
Figure 3: How much each gene’s macrogene partners change between the averaged and longest runs (mean Jaccard; 1 = same partners), by number of isoforms per gene. Grey: each species; coloured: human; dashed: all species. Genes with one isoform have the same protein, and the same vector, under both rules. Dotted line: the change between models.
Genes with more isoforms change partners more, for both models and in most species. ESM-1b: Jaccard 0.37 (one isoform) → 0.32 (2–3) → 0.27 (4–9) → 0.24 (10+). ESMC: 0.21 → 0.15 → 0.11 → 0.09.
Human shows this most strongly: ESM-1b 0.41 for one-isoform genes vs 0.20–0.21 for genes with 4 or more. For ESMC, human genes with 4 or more isoforms (Jaccard 0.05–0.06) change their partners even more than switching the whole model does (0.10).
Ciona and oyster barely show it. Their extra isoforms are probably more similar to each other than human isoforms are (fewer short fragments; Oct 27).
Table 6: The more a gene’s vector changed between averaged and longest, the more its macrogene partners changed (21,790 genes with more than one isoform; Spearman ρ = −0.30 for ESM-1b, −0.41 for ESMC).
Multi-isoform genes, by how much their vector changed (quartiles of 1 − cosine)
least
2nd
3rd
most
ESM-1b: mean partner Jaccard
0.36
0.35
0.31
0.17
ESMC: mean partner Jaccard
0.19
0.17
0.13
0.04
Genes whose vector didn’t change still lose most of their partners (Jaccard 0.37 ESM-1b, 0.21 ESMC). This is the k-means noise of section 1.1: any change anywhere, even none, gives a different partition.
That makes single-isoform genes a built-in noise baseline, and the drop below it for multi-isoform genes is the real isoform effect: noise affects all genes alike, but only multi-isoform genes got new vectors, and the ones whose vectors changed most moved most (Table 6).
The averaged ESM-1b full run (622420, identical inputs and seed to the 10-19 run) will confirm the noise level for six species, and the seed-43 replicate adds seed noise.
5. Species-specific macrogenes
Figure 4: Share of each species’ genes in single-species macrogenes (47,808 common genes). Labels mark changes of 1 percentage point or more.
Table 7: Share of each species’ genes in single-species macrogenes.
% of genes in single-species macrogenes
Mnemiopsis
oyster
Ciona
zebrafish
fly
human
ESM-1b averaged
2.1
7.0
5.6
2.0
7.2
14.0
ESM-1b longest
3.6
8.2
5.8
1.3
7.5
15.9
ESMC averaged
2.6
8.0
7.8
4.1
8.4
21.6
ESMC longest
4.5
8.2
7.6
3.1
9.5
23.0
The hypothesis from Oct 27 was that cleaner human vectors would pull human genes out of human-only macrogenes. They didn’t. The human share rose slightly (+1.9 and +1.4 points).
This is within run-to-run variation:Mnemiopsis genes have exactly the same vectors under both rules, and their share rose by as much (+1.5 and +1.9 points).
Genes move both ways. With ESM-1b, 334 human genes left a human-only macrogene, mostly for two-species macrogenes (262 of 334; most likely zebrafish–human, given the zebrafish–human gain above). 487 moved the other way. ESMC: 471 out, 583 in.
The model effect is again larger: ESMC puts 1.5× as many human genes in human-only macrogenes as ESM-1b, under either rule.
Interpretation
The model choice dominates macrogene structure. ESM-1b vs ESMC changes most macrogene partners and the ortholog recall ~3×. The isoform rule changes fewer partners and recall by ~0.01 overall. The model ranking does not depend on the isoform rule.
The longest isoform is still the better rule, for the right reason. Its macrogene gains are where the embedding gains were (zebrafish–human), and with ESM-1b they come with higher precision. Genes whose vectors changed most changed macrogene most. Nothing got worse beyond what looks like run-to-run variation. This supports keeping the longest isoform as the standard.
Individual macrogenes are not reproducible; aggregate scores are. Macrogenes are essentially one k-means run, and refitting it alone keeps only ~40% (ESM-1b) or ~33% (ESMC) agreement. So a specific macrogene (or its ID) should not be compared across runs, and conclusions should rest on aggregate scores and on effects well beyond k-means noise (here: the model ranking, the zebrafish–human gain, the isoform-count trend). Cells use all 3,000 weighted macrogenes rather than one hard assignment, so the cell-level integration, the next step, may be more stable than the macrogenes themselves; that is worth checking directly.
Human genes in human-only macrogenes are not an isoform artefact. Their share didn’t fall with the longest isoform. The remaining candidates are the target-side explanations from Oct 27: human hub genes, large paralog families, human-specific immune families.
Caveats
Preliminary averaged conditions. For ESMC, the averaged run uses the older files: a different zebrafish gene set (comparisons use the shared genes), and isoform sets not yet forced to match ESM-1b’s. The matched full runs (622420, 622421) replace both averaged conditions around Nov 2.
One seed per condition. Differences of a few hundredths, and changes of 1–2 percentage points in species-specific macrogenes, are not interpretable until the seed replicate is in.
Sequence-based reference (OrthoFinder), as before.
Hardware differs between the averaged runs (parallel nodes) and the longest runs (bigmem, n136). This is one source of the k-means noise in section 1.1.
The k-means noise floor comes from the four-species runs (Oct 9). The six-species value is measured once run 622420 finishes.
Rosen Y. et al. (2024) Toward universal cell embeddings: integrating single-cell RNA-seq datasets across species with SATURN. Nature Methods 21:1492–1500.
Rives A. et al. (2021) Biological structure and function emerge from scaling unsupervised learning to 250 million protein sequences. PNAS 118:e2016239118.
Emms D.M., Kelly S. (2019) OrthoFinder: phylogenetic orthology inference for comparative genomics. Genome Biology 20:238.
Hubert L., Arabie P. (1985) Comparing partitions. Journal of Classification 2:193–218.
Miranda Perez I. (2026) ESMC-600M post-norm export (personal communication, Oct 2026).