one run with ESM-1b gene embeddings and one with the ESMC-600M post-norm export (Oct 20);
macrogene-only runs (pretraining), scored against the new six-species OrthoFinder reference (Oct 20).
ESM-1b macrogenes group true orthologs about 3× more often than ESMC post-norm macrogenes:
pooled recall 0.27 vs 0.08; precision 0.11 vs 0.04 (Table 6);
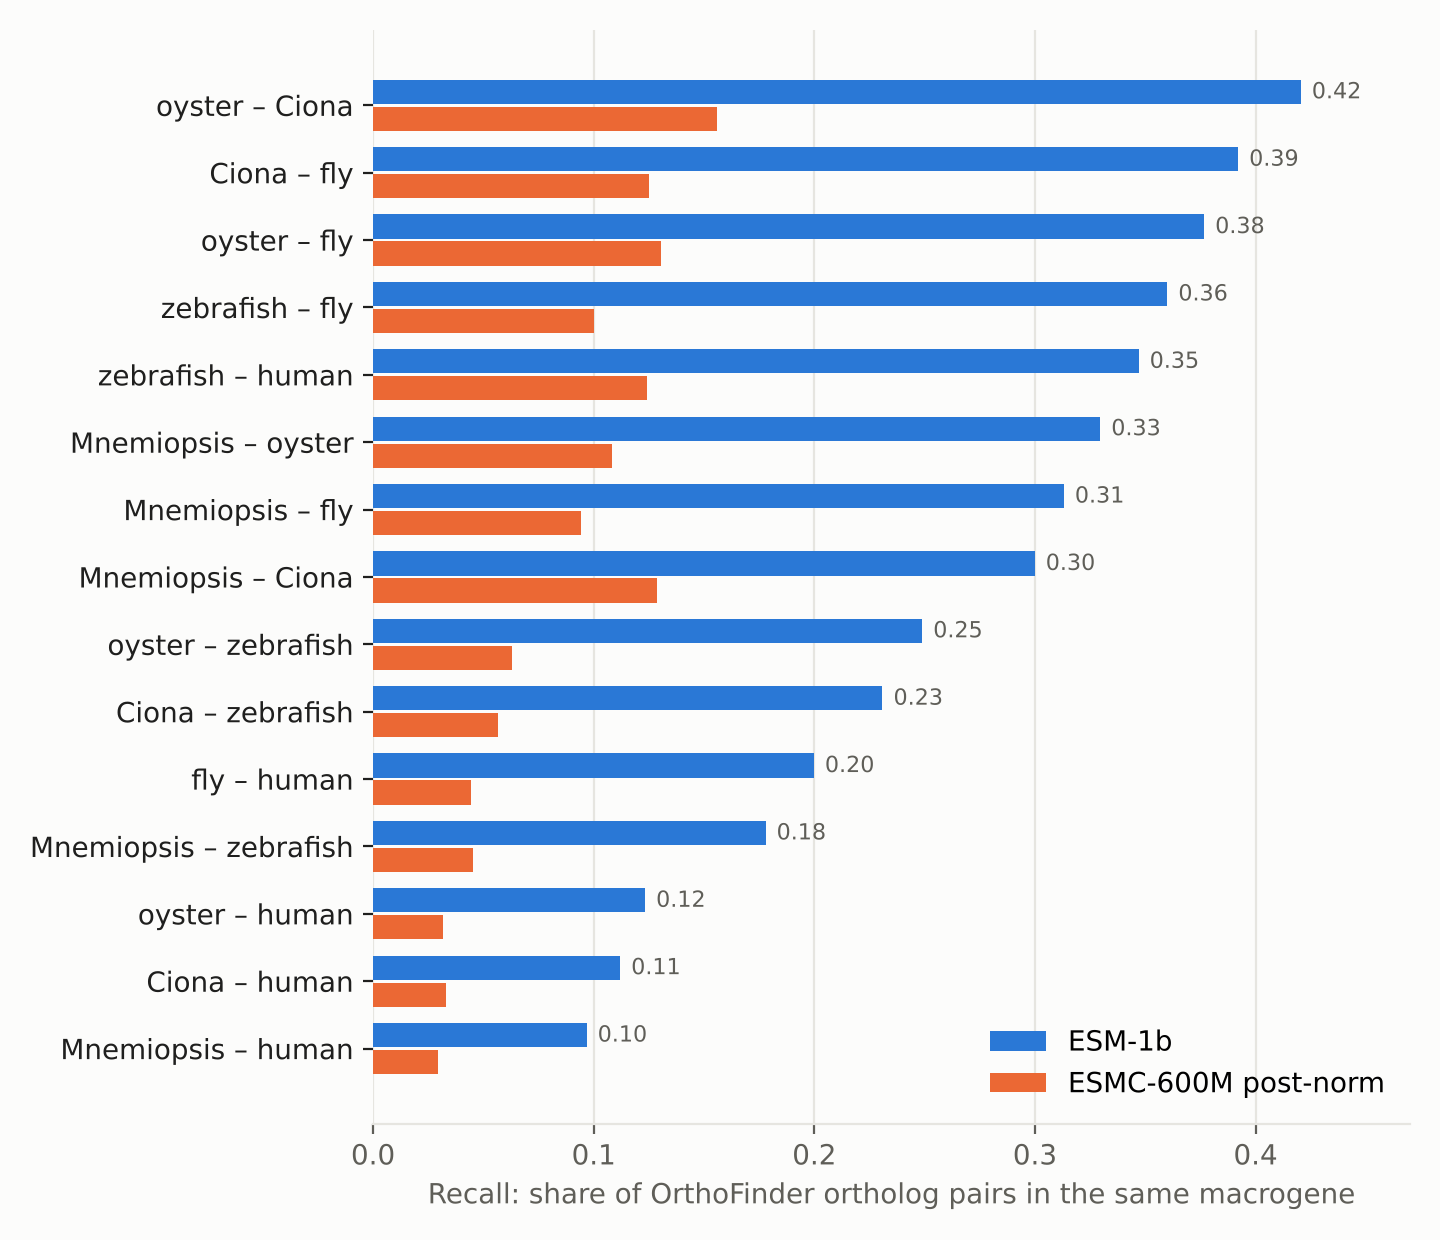
the order holds in all 15 species pairs, against both orthogroups and Metazoa-level groups (Figure 2).
ESMC post-norm makes more species-specific macrogenes: 533 macrogenes contain a single species, vs 262 with ESM-1b (Table 4).
The same gap is already present in the embeddings, before SATURN: with the most-similar-gene test, ESM-1b 0.59 vs ESMC 0.28; after the best standard fix 0.72 vs 0.49 (Table 7).
Human was the weakest species in both runs. A follow-up test found part of the reason: SATURN gene embeddings average all of a gene’s protein isoforms, and human genes have many short ones.
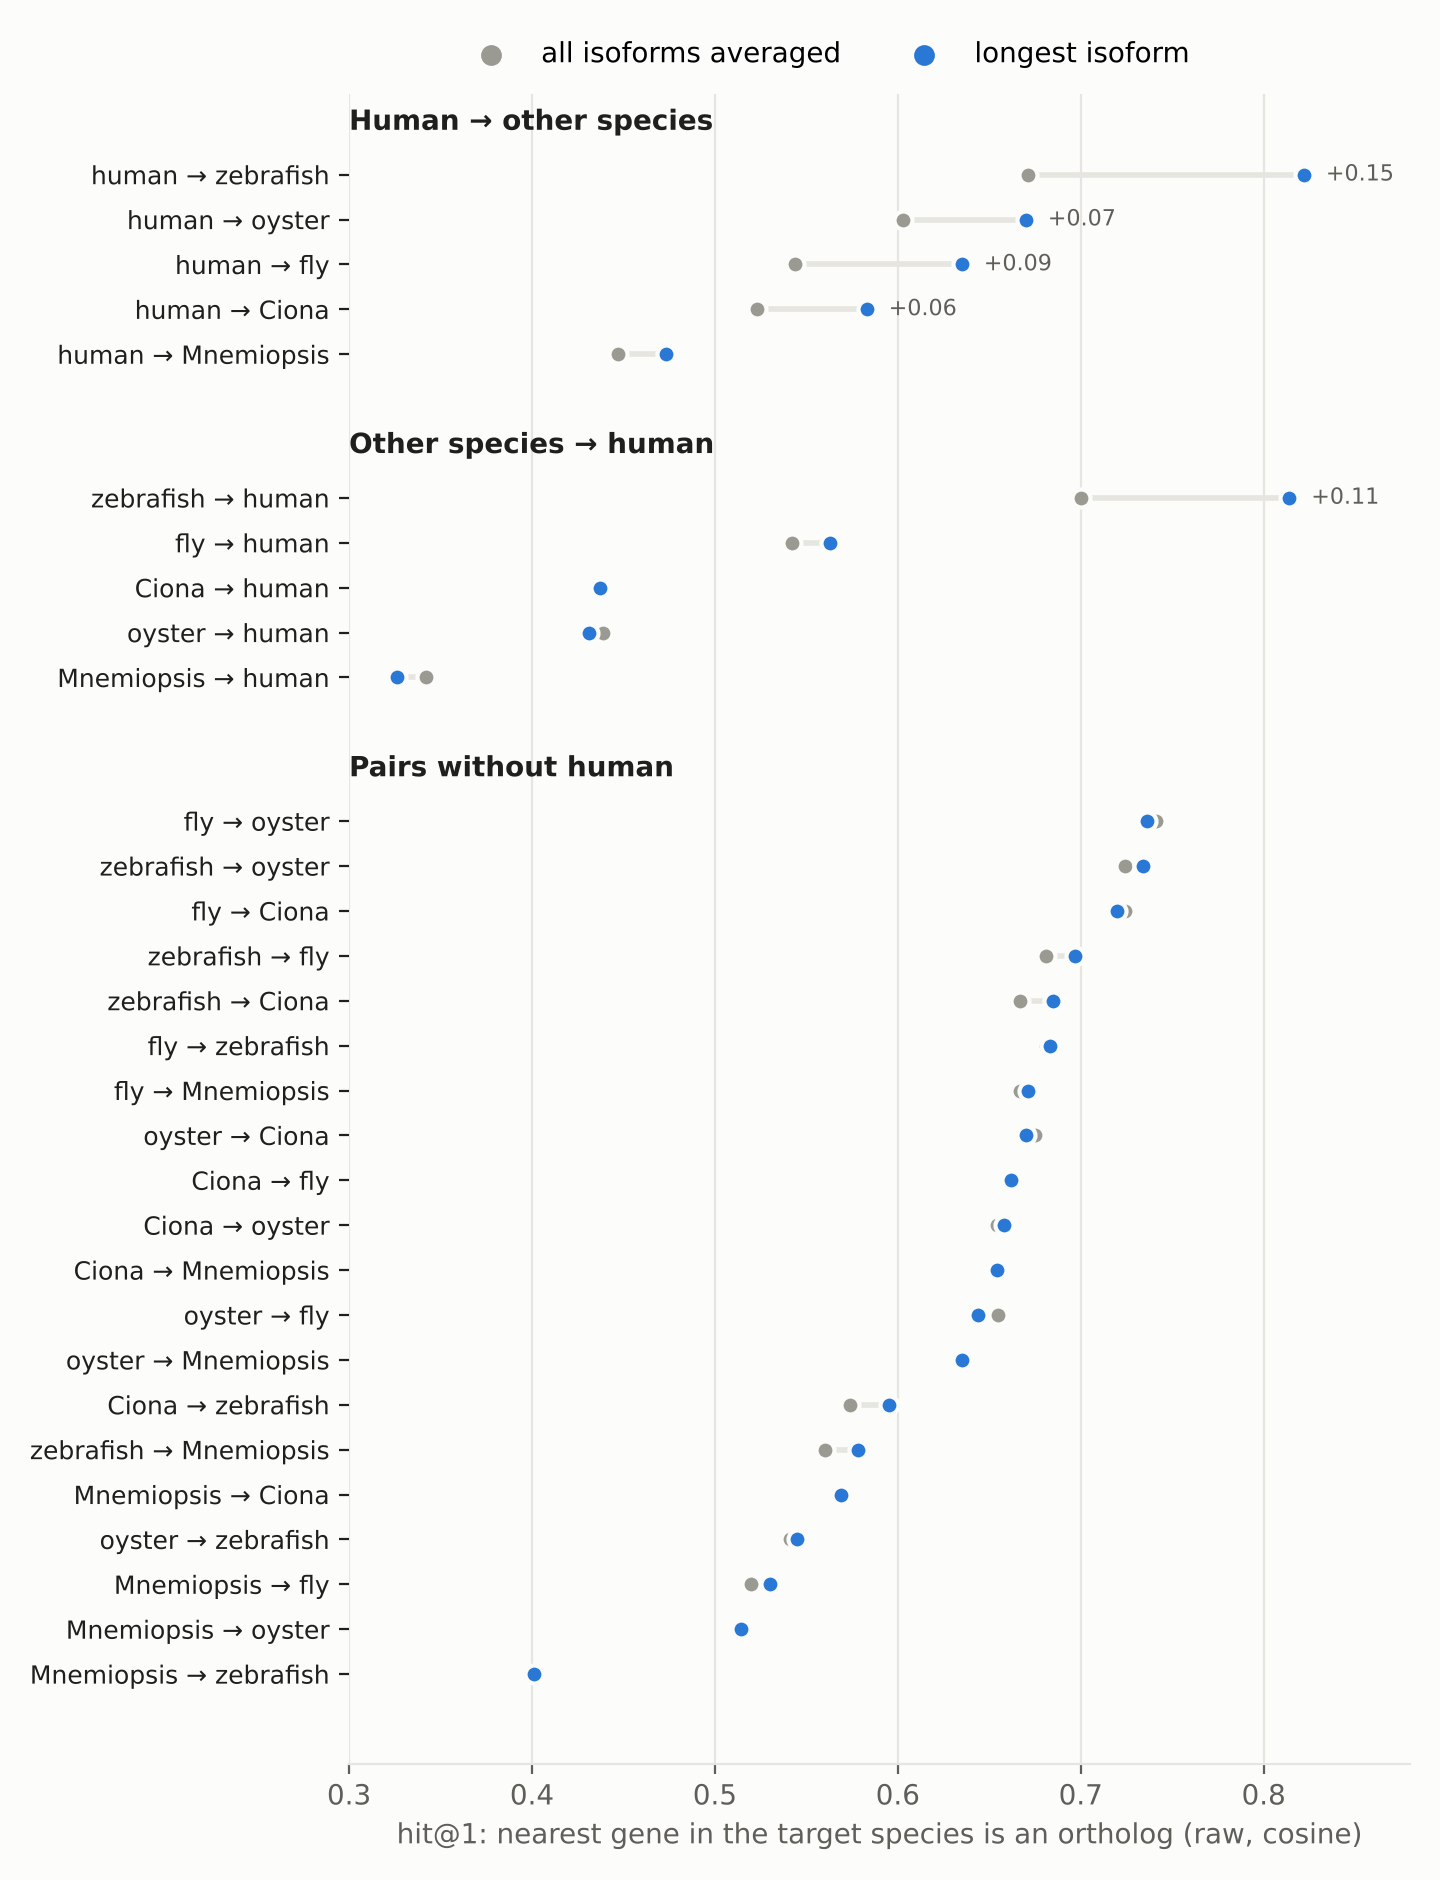
Using the longest isoform instead raised human → zebrafish from 0.67 to 0.82, and zebrafish → human from 0.70 to 0.81 (Figure 5). Zebrafish–human is now the best pair, as expected for the closest species.
Pairs without human barely changed (0.625 → 0.629).
When an invertebrate gene looks for its most similar human gene, the result did not improve (Table 10). That is the remaining open problem.
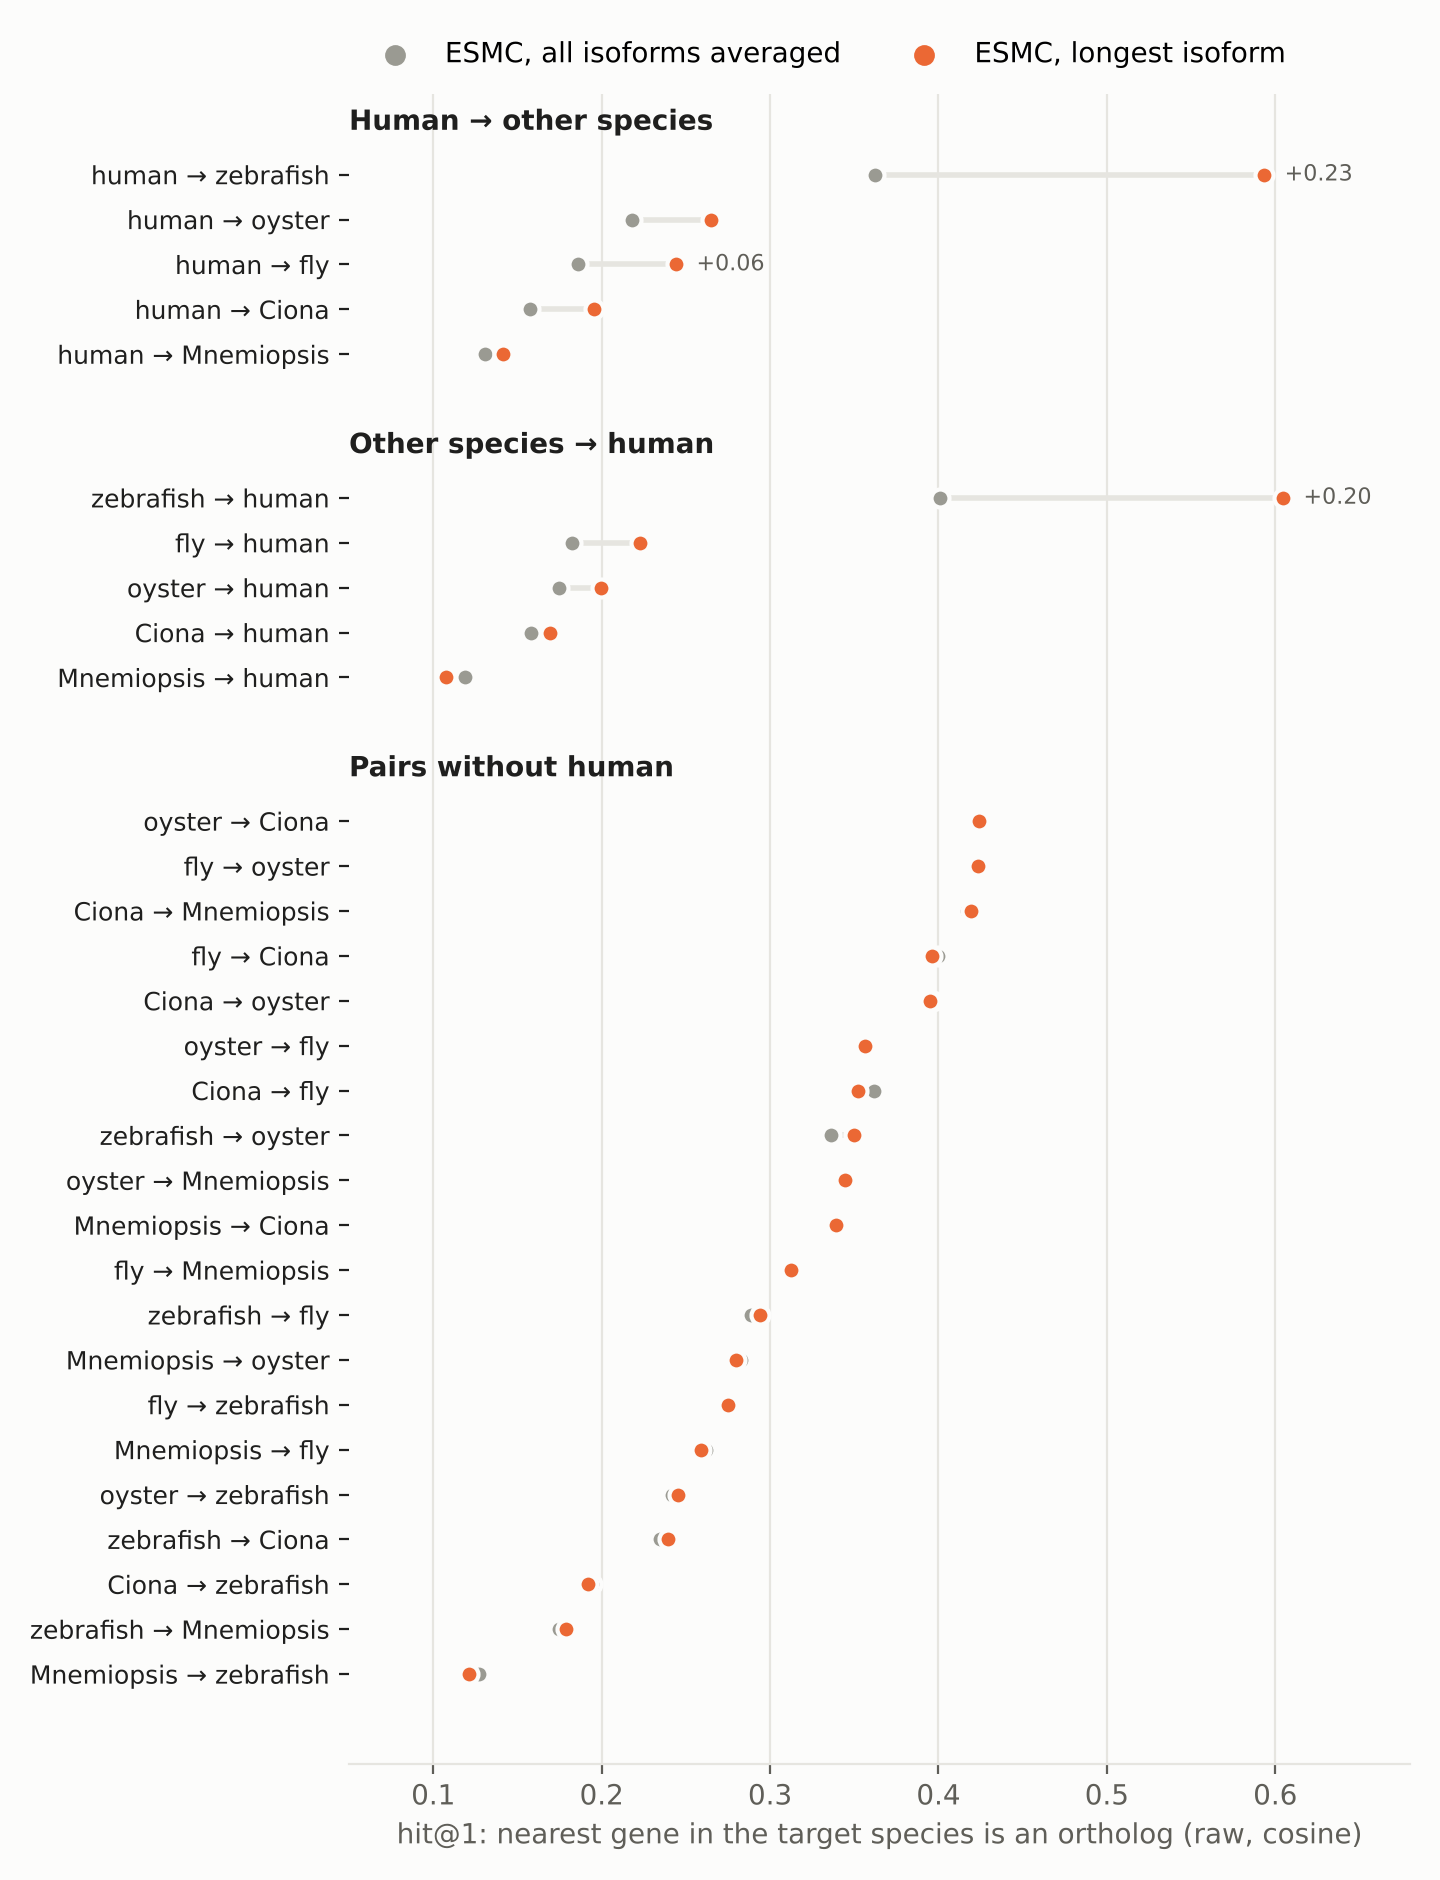
The same fix works for ESMC: human → zebrafish 0.36 → 0.59 and zebrafish → human 0.40 → 0.61 (Table 11). The gap between the models is unchanged (mean over all pairs: ESMC 0.30, ESM-1b 0.61).
These are ortholog-recovery scores, not integration quality. Recovering orthology is one property of a gene embedding. Whether ESMC’s different similarity structure gives a better or worse cell-type integration is a separate question, and is tested next with full SATURN runs for both models (see Interpretation).
This entry follows the four-species comparisons of Oct 6, Oct 8 and Oct 20. It adds fly and human (Oct 15), drops the sea urchin, and uses the six-species OrthoFinder run as the reference. The Oct 20 entry describes how the ESMC post-norm vectors were extracted.
Key terms
Table 1: Terms used in this entry.
Term
Meaning here
Macrogene
A group of genes, from any species, that SATURN builds from the protein embeddings (k-means on the embeddings, then refined during pretraining). Cells are compared through macrogene expression. Each gene has a weight for every macrogene; here a gene is assigned to its highest-weight macrogene.
Macrogene-only run
SATURN pretraining (200 epochs) plus one epoch of metric learning. Macrogene membership is fixed during pretraining, so the full run is not needed to compare macrogenes.
Orthogroup (OG)
Genes descended from one gene in the last common ancestor of the six species (OrthoFinder).
Metazoa-level group (N1 HOG)
OrthoFinder hierarchical orthogroup at the animal node of the species tree. Stricter than an orthogroup: duplications older than the animal ancestor split groups.
Recall
Of all cross-species gene pairs in the same orthogroup, the share placed in the same macrogene.
Precision
Of all cross-species gene pairs placed in the same macrogene, the share in the same orthogroup.
OG recovery
Share of orthogroups with at least one cross-species pair kept together in a macrogene.
Most-similar-gene test (hit@1)
For each gene in species A, is its most similar gene in species B in the same orthogroup? Embeddings only, no SATURN. Averaged over the 30 ordered species pairs.
Isoform
One of several proteins made from the same gene by alternative splicing or alternative start sites.
1. Runs
Table 2: The two macrogene-only runs (Pegasus jobs 603398 and 603399, Oct 19–22).
ESM-1b run
ESMC post-norm run
Gene embeddings
ESM-1b 650M, final layer, mean over residues, first 1,022 residues
ESMC-600M, final block after the final LayerNorm, mean over residues, first 2,000 residues
Per gene
all isoforms averaged (Mnemiopsis: one protein per gene)
final labels of Oct 15 (human 20, fly 15). Labels don’t affect macrogenes (pretraining uses no labels)
same
Hardware
Pegasus parallel queue, 16 CPU cores; ~63 h
same; ~63 h
Both runs use the same HV genes, except in zebrafish. 7,808 of the 8,000 zebrafish HV genes are shared. The two models have embeddings for slightly different zebrafish gene sets, which shifts which genes are picked as highly variable. All comparisons below use the 47,808 genes common to both runs.
2. Orthology reference
The reference is the six-species OrthoFinder run with the choanoflagellate outgroup (Oct 20). Every SATURN HV gene was found in it.
Table 3: Share of each species’ 8,000 HV genes that have an ortholog in another species.
HV genes in a group with another species
Mnemiopsis
oyster
Ciona
zebrafish
fly
human
orthogroups
48%
55%
59%
92%
77%
89%
Metazoa-level groups
47%
55%
58%
92%
76%
89%
About half of the Mnemiopsis HV genes have no ortholog in the other five species, so they can’t count toward recall. Recall is computed only over pairs that exist, so this doesn’t penalize Mnemiopsis, but it means the ctenophore numbers rest on fewer genes.
3. Macrogenes
3.1 Macrogene composition
Table 4: Macrogene composition.
ESM-1b
ESMC post-norm
Median genes per macrogene
12
14
Macrogenes with one gene
19
74
Macrogenes with one species
262
533
Macrogenes with all six species
325
265
Median weight of a gene’s top macrogene
0.70
0.63
Median margin over the second macrogene
0.44
0.36
Table 5: Per species.
Share of genes in single-species macrogenes
Mnemiopsis
oyster
Ciona
zebrafish
fly
human
ESM-1b
2.1%
7.0%
5.6%
1.9%
7.2%
14.0%
ESMC post-norm
2.6%
8.0%
7.8%
4.0%
8.4%
21.0%
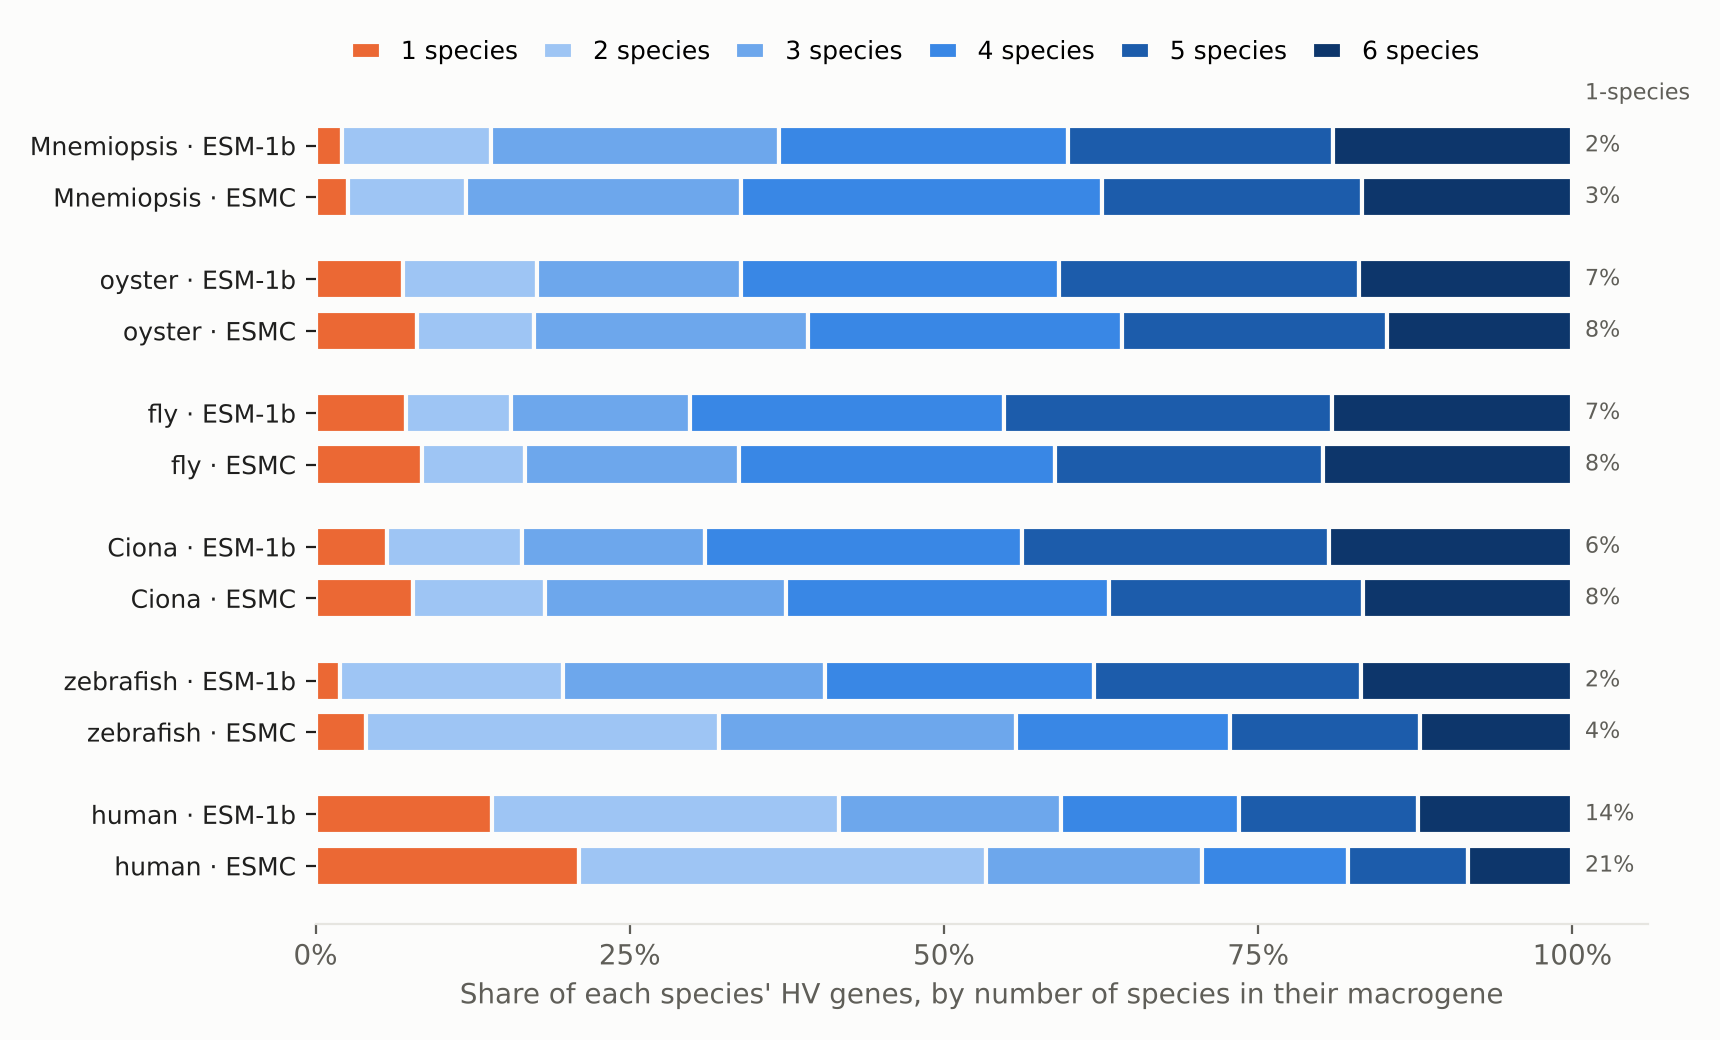
ESMC post-norm groups more genes by species, and assigns them less decisively (lower top weight and margin). This fits its embedding geometry: about 3 effective dimensions and more variance explained by species than ESM-1b (Oct 20).
Human has the most species-specific genes with both models. Section 5 looks at why.
Figure 1: Share of each species’ HV genes by how many species their macrogene contains (orange: single-species macrogenes; darker blue: more species). The percentage on the right is the single-species share.
Human and zebrafish genes sit unusually often in two-species macrogenes: human 28% (ESM-1b) and 32% (ESMC), zebrafish 18% and 28%, vs 8–15% for the invertebrates. The table doesn’t say which two species, but zebrafish–human has by far the most genes paired in the same macrogene (44,380 pairs with ESM-1b), so these are probably vertebrate-only macrogenes. ESMC makes more of them.
The two runs build different macrogenes: adjusted Rand index between them 0.13 (adjusted mutual information 0.30).
3.2 Ortholog benchmark
Table 6: Pooled ortholog benchmark against OrthoFinder orthogroups (Metazoa-level groups in brackets).
ESM-1b
ESMC post-norm
Recall, all pairs
0.27 (0.31)
0.08 (0.10)
Precision, all pairs
0.11 (0.09)
0.04 (0.03)
OG recovery
0.52
0.21
Recall, Mnemiopsis pairs
0.24 (0.33)
0.08 (0.11)
Recall, pairs without Mnemiopsis
0.27 (0.30)
0.09 (0.10)
Recall, zebrafish–human
0.35 (0.37)
0.12 (0.13)
Recall, invertebrate pairs
0.34 (0.41)
0.11 (0.14)
Cross-species gene pairs placed together
336,337
295,862
Random expectation (recall)
< 0.001
< 0.001
Figure 2: Recall per species pair, against OrthoFinder orthogroups.
ESM-1b is ahead on recall, precision and F1 in every one of the 15 species pairs, against both references. With four species and the first ESMC export, the gap was about 2× (Oct 8); here it’s about 3×.
This isn’t a trade-off between recall and precision. ESMC places fewer cross-species gene pairs together and is still less precise.
The ctenophore holds up with ESM-1b. Against the Metazoa-level groups, Mnemiopsis pairs (0.33) score as well as pairs without it (0.30). Precision is lower for Mnemiopsis pairs.
Pairs with human are the weakest for both models (Figure 2, bottom). Human–zebrafish, the closest pair and our positive control, is only fifth (0.35).
4. The same comparison on the embeddings alone
Table 7: Most-similar-gene test on the 47,808 shared HV genes, against six-species OrthoFinder orthogroups.
Most-similar-gene test (hit@1, cosine)
ESM-1b
ESMC post-norm
as delivered
0.59
0.28
z-score per dimension
0.65
0.44
top 2 directions removed
0.71
0.42
top 3 directions removed
0.72
0.49
Mnemiopsis pairs, as delivered
0.53
0.25
Effective dimensions, as delivered
11.6
3.3
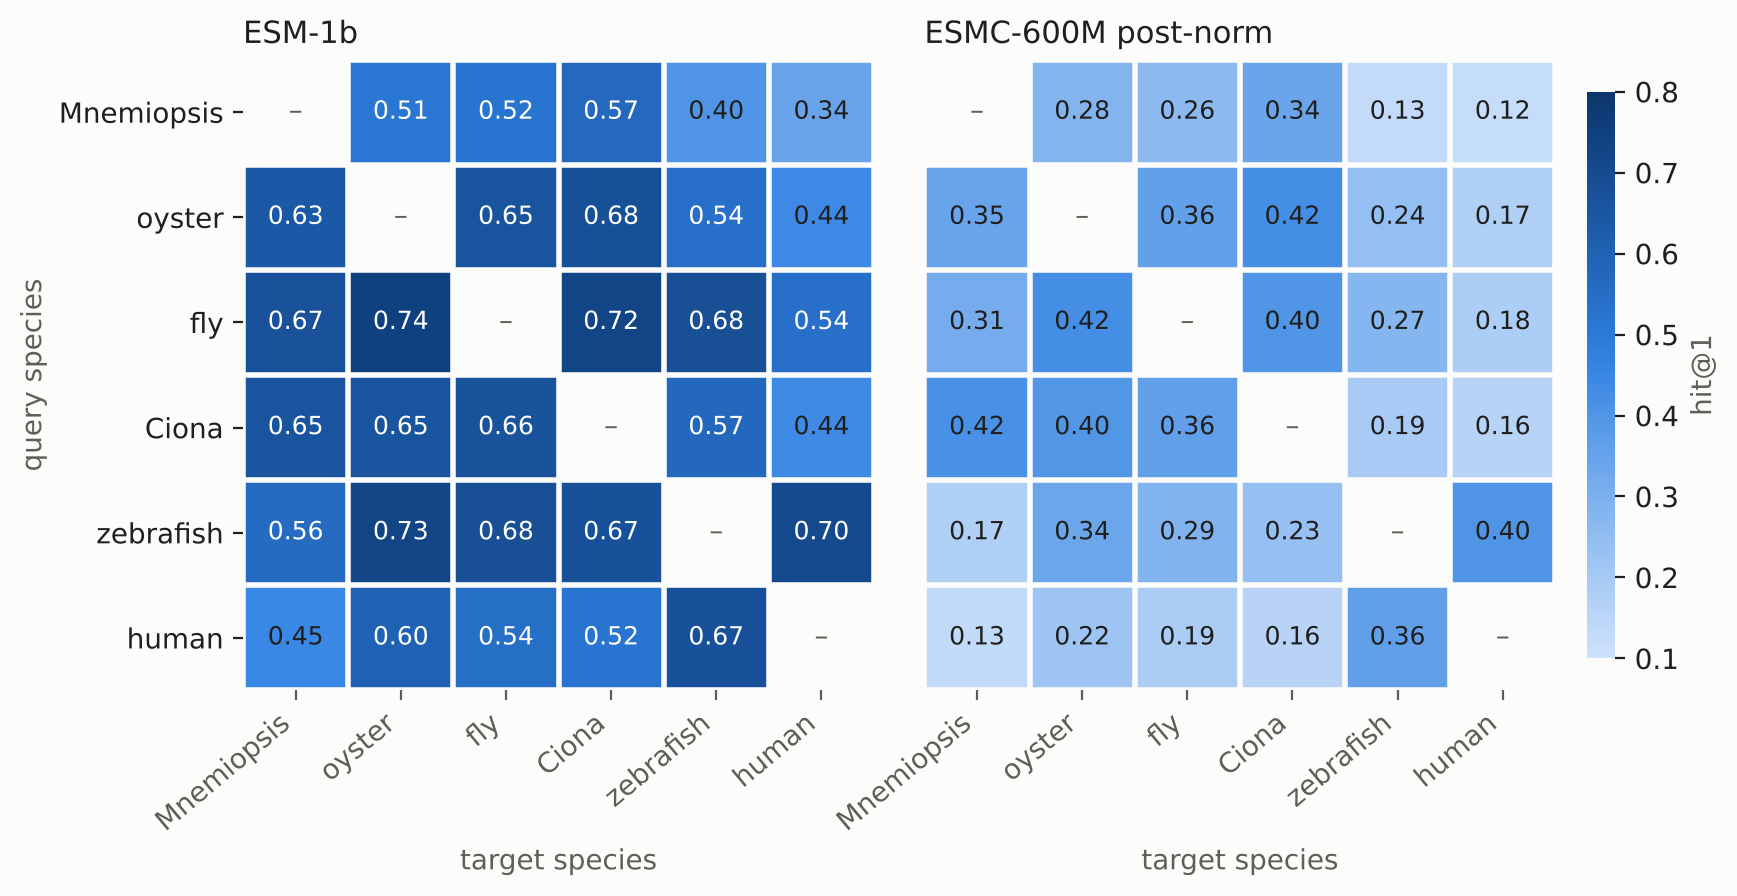
Figure 3: Most-similar-gene test for every ordered species pair (query species in rows, target species in columns; as delivered, cosine; all isoforms averaged).
ESM-1b is higher in all 30 ordered pairs. For ESMC, the pairs between an invertebrate and a vertebrate are the weakest (0.12–0.27), and zebrafish ↔︎ human is its best pair (0.36–0.40).
The four-species result holds with six species and a different reference. ESMC’s best score after any fix (0.49) is below ESM-1b with no fix (0.59).
Removing ESM-1b’s top 2–3 shared directions raises its score from 0.59 to 0.72. SATURN doesn’t normalize gene embeddings, so this may also matter for the macrogenes. It is not tested here.
5. Why human scored low: isoform averaging
Hypothesis. SATURN makes one vector per gene by averaging the embeddings of all its protein isoforms. For human (and fly), we embedded every protein in Ensembl pep.all, which includes many short fragments. Averaging those in could blur the gene vector.
Test. ESM-1b had already been run on every protein separately, so no new embedding was needed. For each gene in all six species, we kept only the longest protein, rebuilt the gene vectors, and reran the most-similar-gene test. Same genes, same HV set, same reference.
Table 8: Isoforms per species, among genes with an ESM-1b embedding.
Mnemiopsis
oyster
Ciona
zebrafish
fly
human
Genes with >1 isoform
0%
35%
42%
53%
51%
80%
Isoforms per such gene
3.9
5.7
2.8
3.4
6.8
Proteins < 100 amino acids
3.8%
0.5%
10.2%
5.2%
4.4%
18.9%
Similarity, longest vs averaged (median cosine)
1.000
1.000
0.9995
1.000
0.9966
Human stands out on every count. The change to the human vectors looks small as a cosine, but raw ESM-1b vectors all share one dominant direction (mean cosine between any two genes ≈ 0.96, Oct 20), so small differences matter for which gene is most similar.
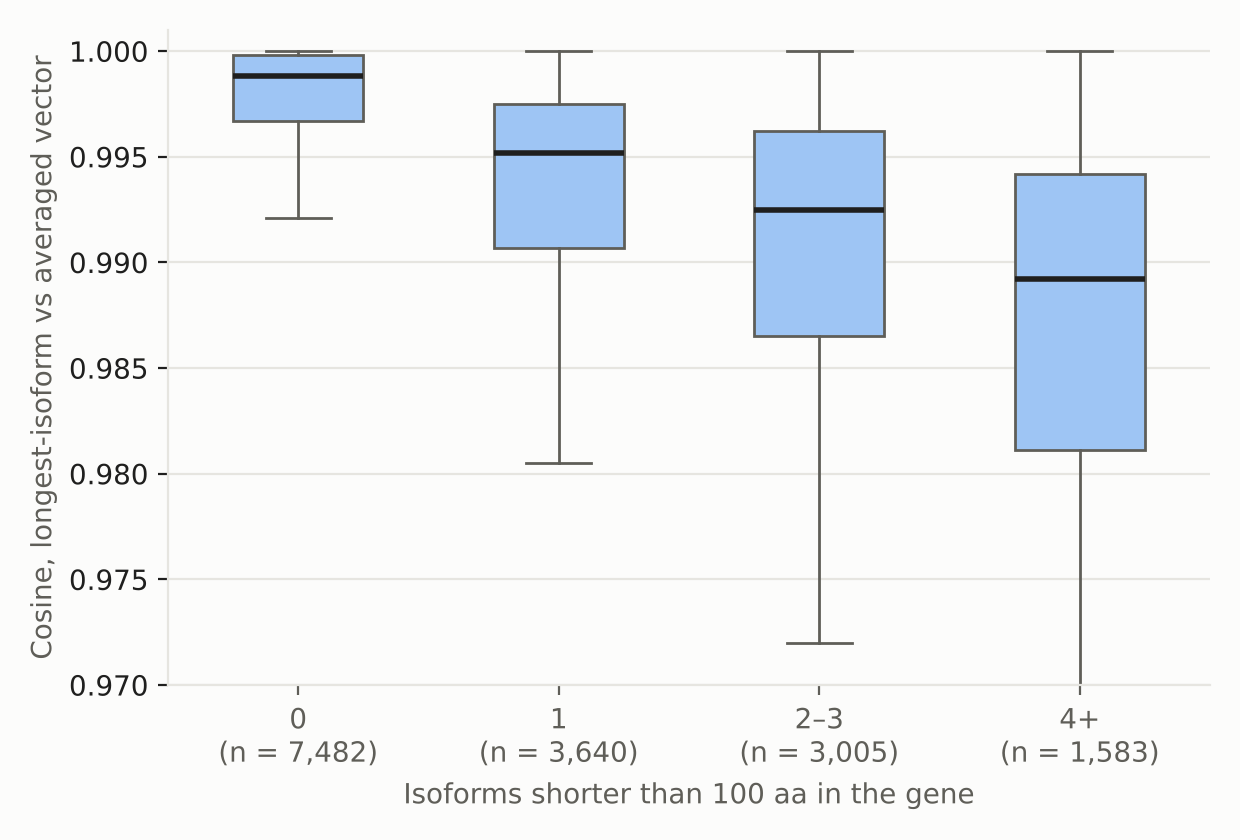
In human, the more short fragments a gene has, the more its averaged vector differs from its longest isoform (Figure 4): median cosine 0.9988 with no fragments, 0.9952 with one, 0.9925 with 2–3, 0.9892 with 4 or more.
Figure 4: Human genes with more than one isoform: similarity between the longest-isoform vector and the averaged vector, by the number of isoforms shorter than 100 amino acids. Outliers not shown.
As a check, the isoform average recomputed from the per-protein files matched the gene file used by SATURN to within 2 × 10⁻⁷ in every species.
Figure 5: Most-similar-gene test per species pair, all isoforms averaged (grey) vs longest isoform (blue). Labels mark changes of 0.05 or more.
Table 10: Pairs involving human (query → target).
hit@1 (cosine)
averaged
longest
human → zebrafish
0.67
0.82
zebrafish → human
0.70
0.81
human → fly / oyster / Ciona
0.54 / 0.60 / 0.52
0.64 / 0.67 / 0.58
fly → human
0.54
0.56
oyster → human
0.44
0.43
Ciona → human
0.44
0.44
Mnemiopsis → human
0.34
0.33
The longest isoform is better overall, under every fix (+0.02 on average), and almost all of the gain is in pairs involving human.
Zebrafish–human is now the best pair (0.81–0.82). A positive control should be the best pair, and with averaged isoforms it wasn’t.
The gain is one-directional. Human genes now find their orthologs much more often. But when an oyster, Ciona or Mnemiopsis gene looks for its most similar human gene, the result is unchanged (0.33–0.44). Possible explanations, not yet tested:
a few human genes are the most similar gene for many invertebrate genes (“hubs”);
large human gene families split across orthogroups;
human-specific immune gene families.
The two macrogene runs above used averaged isoforms. Their human results are therefore partly an isoform effect.
5.1 The same test for ESMC post-norm
Ingrid’s export also has one vector per protein, so ESMC gene vectors were rebuilt the same way. Each gene uses the same protein as ESM-1b: wherever ESM-1b chose between isoforms, the identical protein was found in the ESMC export (100% in every species).
Table 11: Most-similar-gene test for ESMC post-norm, averaged vs longest isoform, with ESM-1b longest for comparison (48,000 HV genes of the six-species ESM-1b run; six-species OrthoFinder orthogroups).
hit@1 (cosine, as delivered)
ESMC, averaged
ESMC, longest
ESM-1b, longest
mean, all pairs
0.276
0.298
0.611
pairs without human
0.310
0.310
0.629
pairs with human
0.209
0.274
0.575
human → zebrafish
0.36
0.59
0.82
zebrafish → human
0.40
0.61
0.81
human → oyster / Ciona / fly / Mnemiopsis
0.22 / 0.16 / 0.19 / 0.13
0.27 / 0.20 / 0.24 / 0.14
0.67 / 0.58 / 0.64 / 0.47
oyster / Ciona / fly / Mnemiopsis → human
0.17 / 0.16 / 0.18 / 0.12
0.20 / 0.17 / 0.22 / 0.11
0.43 / 0.44 / 0.56 / 0.33
Figure 6: Most-similar-gene test per species pair for ESMC post-norm, all isoforms averaged (grey) vs longest isoform (orange). Labels mark changes of 0.05 or more. Compare Figure 5 for ESM-1b.
The isoform effect is not specific to one model. For ESMC, too, the gain is almost entirely in pairs with human (Figure 6), and zebrafish–human becomes its best pair.
The gap between the models stays at about 2×, with or without the fix.
Both models share the same weak spot: an invertebrate gene looking for its most similar human gene (ESMC 0.11–0.22, ESM-1b 0.33–0.56). Since it appears with both models, the cause is more likely on the human side (gene families, hubs) than in either model.
Interpretation
On ortholog recovery, ESM-1b is ahead at every level: embeddings alone, after any standard fix, and in SATURN’s macrogenes. This now holds with six species and two orthology references.
That doesn’t settle which model integrates cell types better. Orthology measures shared ancestry, inferred from sequence. A protein language model’s similarity can in principle also reflect function or structure that isn’t captured by ancestry, for example similar domain architectures in unrelated families. If ESMC captured more of that, its macrogenes could link cell types by shared function (including convergence) rather than shared ancestry, and an orthology benchmark would score this as error. So the full SATURN comparison is needed. What we know so far:
In favour of looking: some ESMC-only macrogene links in the four-species run grouped protein superfamilies with shared domains across species (GPCRs, C-type lectins, TRIM/NLRC5, PARP14; Oct 8).
Against: most ESMC-only links did not share even a Pfam domain (12%, vs 49% for links found only by ESM-1b, and 0.5% for random pairs; Oct 8). ESMC’s extra structure here is mostly species structure (more single-species macrogenes, fewer cross-species neighbours), which would push cells apart by species rather than together by function.
What would decide it: cell-level criteria that don’t come from sequence similarity. Do known corresponding cell types co-cluster (human and zebrafish macrophages; fly plasmatocytes and vertebrate macrophages)? Do paired clusters co-express orthologs of lineage transcription factors (Spi/PU.1, C/EBP, GATA, Runx) more than chance? How much do species mix within shared cell types, and do species-specific types stay separate?
One protein per gene works better than averaging isoforms, for both models and most clearly for human. This becomes the standard for every model, starting with the full runs.
Caveats
One seed per model. Macrogenes vary between runs (ARI ~0.4 across earlier runs with different seeds and species sets), so small differences between models would need several seeds. A 3× difference in recall, consistent across all 15 pairs, is unlikely to be seed noise.
Both references are sequence-based (OrthoFinder), and could favour a model whose similarity follows sequence. See Interpretation 2.
The zebrafish HV genes differ slightly between the two macrogene runs (7,808 of 8,000 shared), because the ESMC zebrafish file covered more genes (19,937 vs 14,179). Comparisons use the shared genes. For the full runs, the ESMC files were restricted to the ESM-1b gene set (zebrafish, and one oyster gene, Cg_lysoz3), so both runs now use identical genes in all six species.
ESMC keeps the first 2,000 residues, ESM-1b the first 1,022. With longest isoforms, 2,174 human genes have a protein longer than 1,022 residues, so the truncation rule needs to be settled too.
The isoform test was run at the embedding level only. Its effect on macrogenes and on the integration will show in the full runs.
Next steps
co-clustering of known corresponding cell types;
mixing of species within shared cell types;
lineage transcription-factor co-expression in paired clusters.
Rosen Y. et al. (2024) Toward universal cell embeddings: integrating single-cell RNA-seq datasets across species with SATURN. Nature Methods 21:1492–1500.
Rives A. et al. (2021) Biological structure and function emerge from scaling unsupervised learning to 250 million protein sequences. PNAS 118:e2016239118.
Candido S. et al. (2026) Language modeling materializes a world model of protein biology. bioRxiv. doi:10.64898/2026.06.03.729735.
Emms D.M., Kelly S. (2019) OrthoFinder: phylogenetic orthology inference for comparative genomics. Genome Biology 20:238.
Mu J., Viswanath P. (2018) All-but-the-top: simple and effective postprocessing for word representations. ICLR 2018. https://arxiv.org/abs/1702.01417
Miranda Perez I. (2026) ESMC-600M post-norm export (personal communication, Oct 2026).